by Calculated Risk on 4/08/2005 07:24:00 PM
Friday, April 08, 2005
Oil Imports as % of GDP
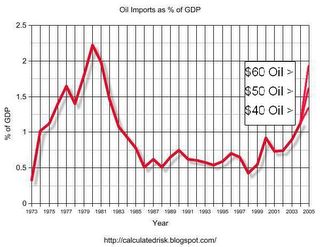
Dr. Altig's graph this morning compared US energy production and consumption (in BTUs) divided by real GDP. Altig defines the difference between consumption and production as our energy dependence. The following graph shows another measure of energy dependence.
Click on graph for larger image.
This graph shows the nominal dollar value of oil imports as a percent of nominal GDP. The data is from the Census Bureau's U.S. Imports of Crude Oil and only goes back to 1973.
For 2004, oil imports were 1.13% of GDP, the highest level since 1982. I plotted three alternatives for 2005: $40 oil, $50 oil and $60 oil. It is important to note that the average contract price paid for oil is usually $5 to $10 below the spot prices. With Oil priced at $53.32 per barrel today, the average import contract price is probably in the mid to high $40s.
For GDP in 2005, I assumed a nominal increase of 6%.
From this chart, $60 oil would be 1.9% of GDP, just below the peak years of 1980 (2.22%) and 1981 (1.98%). For $50 oil, imports would be 1.59% of GDP.
To reach the record 2.22%, with 6% nominal GDP growth, the average price of imported oil would have to be $69 per barrel. Of course we had a recession in 1980, and $60+ imported oil would probably slow GDP growth in 2005 too. With slower growth, oil imports would reach the record as a percentage of GDP somewhere in the mid to low $60s.


