by Calculated Risk on 11/25/2008 08:57:00 AM
Tuesday, November 25, 2008
Case-Shiller House Prices: Free Falling
S&P/Case-Shiller released both the September monthly home price indices for 20 cities (with two composites), and the national house price index. The national index shows prices are off 16.6% from Q3 2007, and off 21% from the peak. I'll have more on the national index shortly.
This post focuses on Case-Shiller prices for 20 individual cities, and two composite indices (10 cities and 20 cities).  Click on graph for larger image in new window.
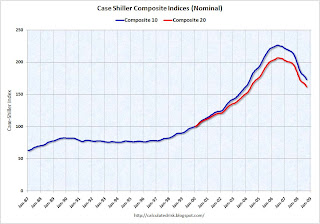
The first graph shows the nominal Composite 10 and Composite 20 indices (the Composite 20 was started in January 2000).
The Composite 10 index is off 23.4% from the peak.
The Composite 20 index is off 21.8% from the peak.
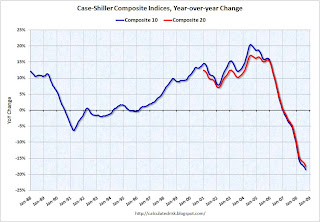
Prices are still falling, and will probably continue to fall for some time.  The second graph shows the Year over year change in both indices.
The Composite 10 is off 18.6% over the last year.
The Composite 20 is off 17.4% over the last year.
The following graph shows the price declines from the peak for each city included in S&P/Case-Shiller indices. In Phoenix and Las Vegas, home prices have declined about 38% from the peak. At the other end of the spectrum, prices in Charlotte and Dallas are only off about 4% from the peak.
I'll have more on prices including price-to-rent and price-to-income ratios soon.


