by Calculated Risk on 12/09/2008 01:49:00 PM
Tuesday, December 09, 2008
The CRE Bust: Quick Overview
This post is a summary of recent commercial real estate (CRE) data suggesting that investment in non-residential real estate will decline sharply over the next several quarters.
Note: There is another problem with CRE too (not discussed here) - many existing properties were recently purchased at prices that were based on overly optimistic pro forma income projections. These loans typically included reserves to pay interest until rents increased (like a negatively amortizing option ARM), and it is likely that many of these deals will blow up when the interest reserve is depleted - probably in the 2009-2010 period.
Historically investment in non-residential structures lags investment in residential by 5 to 8 quarters. The reasons are pretty clear - the commercial builders (for malls, offices, lodging, etc.) usually build after they "see the rooftops", i.e. the residential is in place.
It appears the Commercial Real Estate (CRE) bust has started. Here is a summary of recent data:
 Click on graph for larger image in new window.
 On the heels of a six-point drop in September, the Architecture Billings Index (ABI) plummeted to its lowest level since the survey began in 1995. As a leading economic indicator of construction activity, the ABI shows an approximate nine to twelve month lag time between architecture billings and construction spending. The American Institute of Architects (AIA) reported the October ABI rating was 36.2, down significantly from the 41.4 mark in September (any score above 50 indicates an increase in billings). The inquiries for new projects score was 39.9, also a historic low point.The key here is that the index fell off a cliff in early 2008, and that there is "an approximate nine to twelve month lag time between architecture billings and construction spending". We should expect weaker non-residential structure investment for the foreseeable future (at least through 2009).
emphasis added
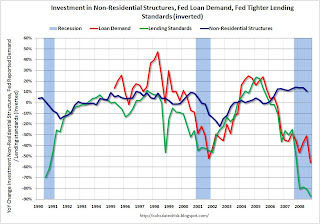
 Of particular interest is the increase in tighter lending standards for Commercial Real Estate (CRE) loans. This graph compares investment in non-residential structure with the Fed's loan survey results for lending standards (inverted) and CRE loan demand.
Note that any reading below zero for loan demand means less demand than the previous quarter. This is strong evidence of a significant slump in CRE investment.
 The graph shows private residential and nonresidential construction spending since 1993.
 Nonresidential construction was at a seasonally adjusted annual rate of $417.7 billion in October, 0.7 percent below the revised September estimate of $420.6 billion.It appears spending on private non-residential construction (blue line) peaked in June and is just starting to decline.
 This graph based on data from the Federal Reserve shows the delinquency rates at the commercial banks for residential and commercial real estate.
Commercial real estate delinquencies are rising rapidly, and are at the highest rate since Q3 '94 (as delinquency rates declined following the S&L crisis).
 From the WSJ: Mall Vacancies Grow as Retailers Pack Up Shop
 For strip centers and other open-air shopping venues, the vacancy rate climbed to 8.4% in the third quarter from 8.1% in the second quarter. That marks the highest rate since 1994, according to Reis.This graph shows the strip mall vacancy rate since Q2 2007. Note that the graph doesn't start at zero to better show the change.
From Reuters: Office vacancy rate reaches 2-year high: report
U.S. office vacancy rose to 13.6 percent, up 0.5 percentage points from the second quarter, its largest one-quarter jump since the second quarter of 2002. The third-quarter vacancy rate was the highest since the second quarter of 2006 and was 110 percentage points higher than its recent low of 12.5 percent set in the third quarter of 2007.
About 23.7 million square feet of office space was available in the third quarter than was leased. About 18.2 million square feet of that was added in just the third quarter, Reis said. That is more than five times the 3.59 million square feet added in the second quarter.
 |
This graph shows the annual occupancy rate for the last 50 years. The data is from PricewaterhouseCoopers LLP (1958 to 1986), and Smith Travel Research (1987 to 2007).
The PricewaterhouseCoopers forecast for 2008 and 2009 are in red. Note: The y-axis starts at 50% to better show the change.


