by Calculated Risk on 12/22/2008 02:29:00 PM
Monday, December 22, 2008
Credit Crisis Indicators
The sharp decline in treasury yields had continued across the board. Click on graph for larger image in new window.
The 10-year yield is at 2.11% today, slightly above the record low of 2.07% set last Thursday.
This graph shows the 10 year yield since 1962. The smaller graph shows the ten year yield for this year - talk about cliff diving!
The yield on 3 month treasuries is 0.00% (bad). Right at ZERO when I checked!
Here are a few other indicators of credit stress:
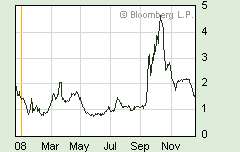
 | The TED spread was stuck above 2.0 for some time. The peak was 4.63 on Oct 10th. I'd like to see the spread move back down to 1.0 or lower. A normal spread is around 0.5. |

This is the spread between high and low quality 30 day nonfinancial commercial paper. Right now quality 30 day nonfinancial paper is yielding close to zero. If the credit crisis eases, I'd expect a significant decline in this spread - and the graph makes it clear this indicator is still in crisis.
 |
It appears the Fed is finally getting some rates down - but clearly the 3-month treasury yield at zero is not a sign of a healthy economy.


