by Calculated Risk on 1/26/2009 11:26:00 AM
Monday, January 26, 2009
Existing Home Sales (NSA)
Here is another way to look at existing homes sales - monthly, Not Seasonally Adjusted (NSA): This graph shows NSA monthly existing home sales for 2005 through 2008. Sales (NSA) were slightly higher in December 2008 than in December 2007.
For three of the last four months, sales in 2008 were close to, or slightly higher, than the level of 2007.
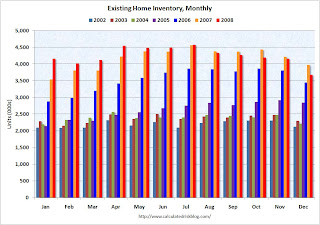
However a much larger percentage of the sales in 2008, compared to 2007, were foreclosure resales, and although these are real sales, I think existing home sales will fall further when foreclosure resales start to decline. The second graph shows inventory by month starting in 2002.
Inventory levels were flat for years (during the bubble), but started increasing at the end of 2005.
Inventory levels increased sharply in 2006 and 2007, but have been close to 2007 levels for most of 2008. In fact inventory for the last five months was below the levels of last year. This might indicate that inventory levels are close to the peak for this cycle. Note: there is probably a substantial shadow inventory – homeowners wanting to sell, but waiting for a better market - so existing home inventory levels will probably stay elevated for some time. There is also the possibility of some ghost inventory (REOs being held off the market).
It is important to watch inventory levels very carefully. If you look at the 2005 inventory data, instead of staying flat for most of the year (like the previous bubble years), inventory continued to increase all year. That was one of the key signs that led me to call the top in the housing market!
If the trend of declining year-over-year inventory levels continues in 2009 that will be a positive for the housing market. Prices will probably continue to fall until the months of supply reaches more normal levels (in the 6 to 8 month range), and that might take some time - especially if sales continue to fall in 2009 as I expect.


