by Calculated Risk on 1/14/2009 08:32:00 AM
Wednesday, January 14, 2009
Retail Sales Collapse in December
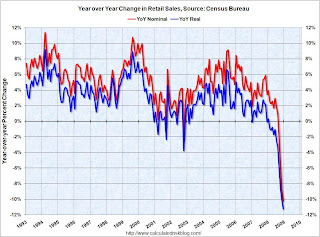
The following graph shows the year-over-year change in nominal and real retail sales since 1993.  Click on graph for larger image in new window.
To calculate the real change, the monthly PCE price index from the BEA was used (December PCE prices was estimated as the same as November).
Although the Census Bureau reported that nominal retail sales decreased 10.2% year-over-year (retail and food services decreased 9.8%), real retail sales declined by 11.3% (on a YoY basis). This is the largest YoY decline since the Census Bureau started keeping data.
There is the Census Bureau report:
The U.S. Census Bureau announced today that advance estimates of U.S. retail and food services sales for December, adjusted for seasonal variation and holiday and trading-day differences, but not for price changes, were $343.2 billion, a decrease of 2.7 percent (±0.5%) from the previous month and 9.8 percent (±0.7%) below December 2007. Total sales for the 12 months of 2008 were down 0.1 percent (±0.4%)* from 2007. Total sales for the October through December 2008 period were down 7.7 percent (±0.5%) from the same period a year ago. The October to November 2008 percent change was revised from -1.8 percent (±0.5%) to -2.1 percent (±0.3%).
Retail trade sales were down 2.7 percent (±0.5%) from November 2008 and were 10.8 percent (±0.7%) below last year. Gasoline stations sales were down 35.5 percent (±1.5%) from December 2007 and motor vehicle and parts dealers sales were down 22.4 percent (±2.3%) from last year.
Retail sales are a key portion of consumer spending and real retail sales have fallen off a cliff.


