by Calculated Risk on 3/07/2009 12:43:00 PM
Saturday, March 07, 2009
The Oil Cushion
Last year I wrote a post about how falling oil prices would provide some cushion for the U.S. economy: The Oil Cushion. Here is an update ...
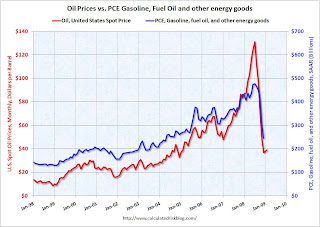
The following graph shows the monthly personal consumption expenditures (PCE) at a seasonally adjusted annual rate (SAAR) for gasoline, oil and other energy goods compared to the U.S. spot price for oil (monthly). Click on graph for larger image in new window.
The good news is at current oil prices (U.S. spot prices averaged about $39 per barrel in February), oil related PCE will be in the $250 billion seasonally adjusted annual rate (SAAR) range in Q1 - well below the $440 billion SAAR of the first 8 months of 2008.
This is a savings of about $16 billion per month compared to the first 8 months of 2008. That savings will definitely provide a cushion for consumers.
The previous two quarters (Q3 and Q4) saw two of the four largest percentage declines in PCE in the last 40 years (-4.3% and -3.8% respectively). But there was little or no oil cushion in Q3, and about $7 billion per month in Q4 ... and as expected, the Q4 oil cushion showed up more as savings, as opposed to other consumption. But savings is a help too, because rebuilding savings is a necessary step towards rebuilding household balance sheets.
In Q1 the oil savings is much larger and will probably provide more of a cushion for consumers.
Data sources:
PCE from BEA underlying detail tables: Table 2.4.5U. Personal Consumption Expenditures by Type of Product line 117.
Oil prices from EIA U.S. Spot Prices.


