by Calculated Risk on 3/31/2009 11:00:00 AM
Tuesday, March 31, 2009
Philly Fed State Indexes: We're all Red States now!
 Click on map for larger image.
Here is a map of the three month change in the Philly Fed state coincident indicators. All 50 states are showing declining activity.
This is the new definition of "Red states".
This is what a widespread recession looks like based on the Philly Fed states indexes.
On a one month basis, activity decreased in all 50 states in February. Here is the Philadelphia Fed state coincident index release for February.
The Federal Reserve Bank of Philadelphia has released the coincident indexes for the 50 states for February 2009. The indexes decreased in all 50 states both for the month and for the past three months (one-month and three-month diffusion indexes of -100).
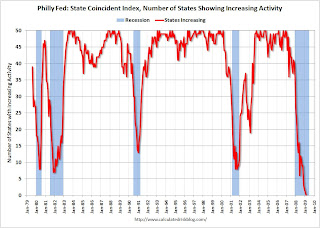
 The second graph is of the monthly Philly Fed data of the number of states with one month increasing activity. Most of the U.S. was has been in recession since December 2007 based on this indicator.
All states showed declining activity. A widespread recession ...


