by Calculated Risk on 4/15/2009 01:00:00 PM
Wednesday, April 15, 2009
NAHB: Builder Confidence Increases in April
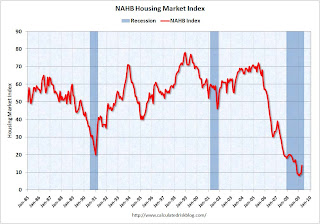
 Click on graph for larger image in new window.
This graph shows the builder confidence index from the National Association of Home Builders (NAHB).
The housing market index (HMI) increased to 14 in April from 9 in March. The record low was 8 set in January.
The increase in April follows five consecutive months at either 8 or 9.
Note: any number under 50 indicates that more builders view sales conditions as poor than good.
Press release from the NAHB (added): April Data Suggests Market At or Near Bottom
Builder confidence in the market for newly built, single-family homes rose five points in April to the highest level since October 2008, according to the latest National Association of Home Builders/Wells Fargo Housing Market Index (HMI), released today. This gain was the largest one-month increase recorded since May of 2003, and brings the HMI out of single-digit territory for the first time in six months – to 14. Every component of the HMI reflected the boost, with the biggest gain recorded for sales expectations in the next six months.
...
“This is a very encouraging sign that we are at or near the bottom of the current housing depression,” said NAHB Chief Economist David Crowe. “With the prime home buying season now underway, builders report that more buyers are responding to the pull of much-improved affordability measures, including low home prices, extremely favorable mortgage rates and the introduction of the $8,000 first-time home buyer tax credit.”
...
Derived from a monthly survey that NAHB has been conducting for more than 20 years, the NAHB/Wells Fargo HMI gauges builder perceptions of current single-family home sales and sales expectations in the next six months as “good,” “fair” or “poor.” The survey also asks builders to rate traffic of prospective buyers as “high to very high,” “average” or “low to very low.” Scores for each component are then used to calculate a seasonally adjusted index where any number over 50 indicates that more builders view conditions as good than poor.
Each of the HMI’s component indexes recorded substantial gains in April. The largest of these gains was a 10-point surge in the component gauging builder sales expectations for the next six months, which brought that index to 25. The component gauging current sales conditions and the component gauging traffic of prospective buyers each rose five points, to 13 and 14, respectively.
The HMI also rose in every region in April, with an eight-point gain to 16 in the Northeast, a six-point gain to 14 in the Midwest, a five-point gain to 17 in the South and a 4-point gain to 9 in the West.


