by Calculated Risk on 4/13/2009 04:09:00 PM
Monday, April 13, 2009
Oregon Unemployment Rate Ties Record High in 60+ Years
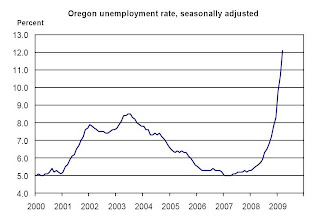
From Oregon.gov (ht Justin):  This graph is from Oregon’s Employment Situation: March 2009 and shows the Oregon unemployment rate since Jan 2000.
The unemployment rate is at the peak level of the 1982 recession - the highest since record keeping started in 1947. The unemployment rate is increasing rapidly, and the rate of increase appears to be accelerating.
Oregon’s seasonally adjusted unemployment rate rose to 12.1 percent in March from 10.7 percent (as revised) in February. The state’s unemployment rate has risen rapidly and substantially over the past nine months, from a rate of 5.9 percent in June 2008.
...
Manufacturing shed 2,100 jobs in March, during a time of year when a flat employment pattern is typical. Employment stood at 171,600 in March, which was by far the lowest employment level since comparable records began in 1990.
...
Construction losses steepened, dropping 1,700 jobs at a time of year when a gain of 700 was the expected normal seasonal movement. The rate of seasonally adjusted losses in construction has quickened, as the industry is down 12,600 jobs or 13.6 percent over the past six months.
Seasonally adjusted construction employment, at 80,000, is now below its level of approximately 83,000 jobs seen during much of 1997 through 2000. Despite a drop of more than 25,000 jobs since reaching its peak in 2007, construction is still slightly above its low point over the past dozen years—75,500, which was reached in June 2003.
...
Oregon’s seasonally adjusted unemployment rate rose to 12.1 percent from 10.7 percent in February. This tied Oregon’s unemployment rate in November 1982, the highpoint of the early 1980s recession. While historical records prior to 1976 are not exactly comparable, it appears clear that the 12.1 percent level is Oregon’s highest since 1947, when the Employment Department first started publishing unemployment rates.


