by Calculated Risk on 4/09/2009 08:44:00 AM
Thursday, April 09, 2009
U.S. Trade Deficit: Lowest Since 1999
The collapse in trade continues to be an important story.
The Census Bureau reports:
[T]otal February exports of $126.8 billion and imports of $152.7 billion resulted in a goods and services deficit of $26.0 billion, down from $36.2 billion in January, revised. February exports were $2.0 billion more than January exports of $124.7 billion. February imports were $8.2 billion less than January imports of $160.9 billion.
 Click on graph for larger image.
The first graph shows the monthly U.S. exports and imports in dollars through February 2009. The recent rapid decline in foreign trade continued in February. Note that a large portion of the recent decline in imports was related to the fall in oil prices, however the decline in February was mostly non-oil related.
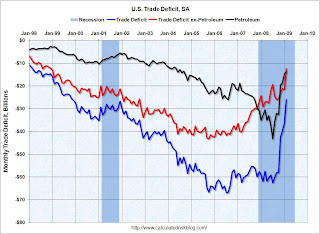
The second graph shows the U.S. trade deficit, with and without petroleum, through February.
 The blue line is the total deficit, and the black line is the petroleum deficit, and the red line is the trade deficit ex-petroleum products.
 Import oil prices fell slightly to $39.22 in February, from $39.81 in January, and import quantities decreased too - so the petroleum deficit declined by $1 billion.
However most of the decline in the trade deficit was non-oil related.
I suppose a collapse in U.S. imports is one way to rebalance the world economy ...


