by Calculated Risk on 6/29/2009 08:48:00 AM
Monday, June 29, 2009
Freddie Mac June Investor Presentation
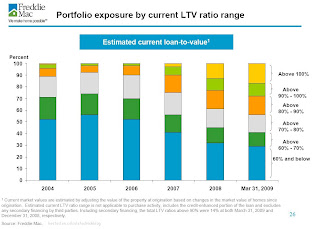
Here are a few graphs from the Freddie Mac June Investor Presentation. Click on graph for large image.
The first graph shows the average LTV of the Freddie Portfolio (graph doesn't start at zero).
The second graph shows the current breakdown by LTV and credit score.
According to Freddie Mac's estimate, 17% of the mortgages in their portfolio have negative equity. Another 11% of the loans have less than 10% equity.
According to the Census Bureau, 51.6 million U.S. owner occupied homes had mortgages (end of 2007, see data here)
This would suggest that 8.8 million households have negative equity (51.6 million times 17%), and another 5.7 have 10% or less equity. However, the loans from Freddie Mac were better than most, and this is probably the lower bound for homeowners with negative equity. The third graphs show how the LTV breakdown has shifted over time as house prices have fallen.
I'm surprised that any loans had negative equity in 2004, but just over 10% of the portfolio appeared to have LTV portfolio risk in 2004. Falling house prices has changed the mix!
Note: I'd consider the Zillow estimate of 20.4 million homeowners with negative equity as the upper bound (and I think their estimate is too high).
About 20.4 million of the 93 million houses, condos and co- ops in the U.S. were worth less than their loans as of March 31, according to Seattle-based real estate data service Zillow.com.There is much more in the Freddie Mac presentation.


