by Calculated Risk on 7/02/2009 10:33:00 AM
Thursday, July 02, 2009
Employment-Population Ratio, Part Time Workers, Hours Worked
A few more graphs based on the (un)employment report ...
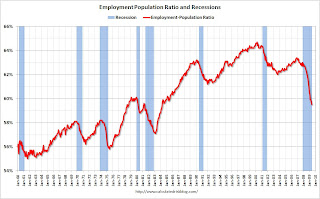
Employment-Population Ratio Click on graph for larger image in new window.
This graph show the employment-population ratio; this is the ratio of employed Americans to the adult population.
Note: the graph doesn't start at zero to better show the change.
The general upward trend from the early '60s was mostly due to women entering the workforce. As an example, in 1964 women were about 32% of the workforce, today the percentage is close to 50%.
This measure is at the lowest level since the early '80s and shows the weak recovery following the 2001 recession - and the current cliff diving!
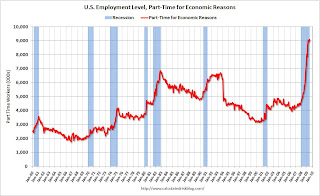
Part Time for Economic Reasons
From the BLS report:
The number of persons working part time for economic reasons (sometimes referred to as involuntary part-time workers) was little changed in June at 9.0 million. Since the start of the recession, the number of such workers has increased by 4.4 million.Note: "This category includes persons who would like to work full time but were working part time because their hours had been cut back or because they were unable to find full-time jobs."
 Not only has the unemployment rate risen sharply to 9.5%, but the number of workers only able to find part time jobs (or have had their hours cut for economic reasons) is at 9.0 million.
Of course the U.S. population is significantly larger today (about 305 million) than in the early '80s (about 228 million) when the number of part time workers almost reached 7 million. That is the equivalent of about 9.3 million today, so population adjusted this isn't quite a record - but close.
Average Weekly Hours
From the BLS report:
In June, the average workweek for production and nonsupervisory workers on private nonfarm payrolls fell by 0.1 hour to 33.0 hours--the lowest level on record for the series, which began in 1964.
 The average weekly hours has been declining since the early '60s, but usually falls sharply during a recession. As the BLS noted, average weekly hours in June was at the lowest level since the series began in 1964.
Note: the graph doesn't start at zero to better show the change.
Several analysts follow this series to look for the end of a recession. Usually companies increase the work week before they start hiring, so the average weekly hours increases as a recession ends. Something to watch ...
Earlier employment posts today:


