by Calculated Risk on 7/02/2009 09:25:00 AM
Thursday, July 02, 2009
Unemployment: Stress Test Scenarios, Diffusion Index, Weekly Claims
Note: earlier Employment post: Employment Report: 467K Jobs Lost, 9.5% Unemployment Rate. The earlier post includes a comparison to previous recessions.
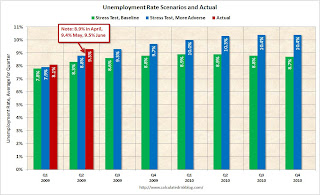
Stress Test Scenarios Click on graph for larger image in new window.
This graph shows the unemployment rate compared to the stress test economic scenarios on a quarterly basis as provided by the regulators to the banks (no link).
This is a quarterly forecast: the Unemployment Rate in Q2 was higher than the "more adverse" scenario.
Note also that the unemployment rate has already exceeded the peak of the "baseline scenario".
Diffusion Index
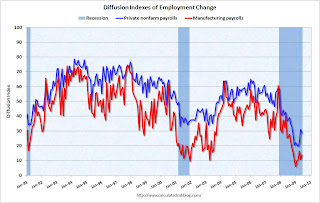
Here is a look at how "widespread" the job losses are using the employment diffusion index from the BLS.
Job losses were widespread across the major industry sectors, with large declines occurring in manufacturing, professional and business services, and construction.
BLS, June Employment Report
 The BLS diffusion index is a measure of how widespread changes in employment are. Some people think it measures the percent of industries increasing employment, but that isn't quite correct.
From the BLS handbook:
The diffusion indexes for private nonfarm payroll employment are based on estimates for 278 industries, while the manufacturing indexes are based on estimates for 84 industries. Each component series is assigned a value of 0, 50, or 100 percent, depending on whether its employment showed a decrease, no change, or an increase over a given period. The average (mean) value is then calculated, and this percent is the diffusion index number.Think of this as a measure of how widespread the job losses are across industries. The further from 50 (above or below), the more widespread the job losses or gains reported by the BLS.
Before September, the all industries employment diffusion index was close to 40, suggesting that job losses were limited to a few industries. However starting in September the diffusion index plummeted. In December, the index hit 20.5, suggesting job losses were very widespread. The index has recovered since then, but declined slightly in June to 28.6, suggesting job losses are still widespread.
The manufacturing diffusion index fell even further, from 40 in May 2008 to just 6 in January 2009. The manufacturing index is still very low in June (13.9) indicating widespread job losses.
Initial Weekly Unemployment Claims
The DOL reports on weekly unemployment insurance claims:
In the week ending June 27, the advance figure for seasonally adjusted initial claims was 614,000, a decrease of 16,000 from the previous week's revised figure of 630,000. The 4-week moving average was 615,250, a decrease of 2,750 from the previous week's revised average of 618,000.
...
The advance number for seasonally adjusted insured unemployment during the week ending June 20 was 6,702,000, a decrease of 53,000 from the preceding week's revised level of 6,755,000.
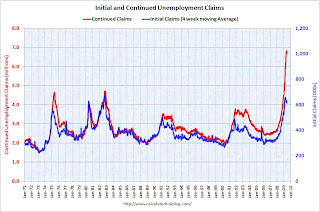
 This graph shows weekly claims and continued claims since 1971.
Continued claims decreased to 6.70 million. This is 5.0% of covered employment.
The four-week average of weekly unemployment claims decreased this week, and is now 43,500 below the peak of 12 weeks ago. There is a reasonable chance that claims have peaked for this cycle.
However the level of initial claims (over 614 thousand) is still very high, indicating significant weakness in the job market.


