by Calculated Risk on 8/12/2009 08:30:00 AM
Wednesday, August 12, 2009
Trade Deficit Increases in June
The Census Bureau reports:
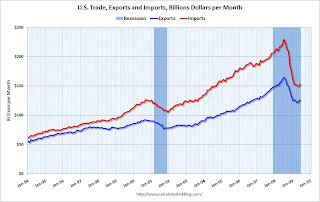
The ... total June exports of $125.8 billion and imports of $152.8 billion resulted in a goods and services deficit of $27.0 billion, up from $26.0 billion in May, revised. June exports were $2.4 billon more than May exports of $123.4 billion. June imports were $3.5 billion more than May imports of $149.3 billion.
 Click on graph for larger image.
The first graph shows the monthly U.S. exports and imports in dollars through June 2009.
Imports were up in June, mostly because of a spike in oil prices. Exports also increased in June. On a year-over-year basis, exports are off 22% and imports are off 31%.
The second graph shows the U.S. trade deficit, with and without petroleum, through June.
 The blue line is the total deficit, and the black line is the petroleum deficit, and the red line is the trade deficit ex-petroleum products.
 Import oil prices increased to $59.17 in June - up about 50% from the prices in February - and the fourth monthly increase in a row. Import oil prices will rise further for July and August.
It appears the cliff diving for U.S. trade might be over - especially for U.S. exports.


