by Calculated Risk on 9/24/2009 10:00:00 AM
Thursday, September 24, 2009
Existing Home Sales Decline in August
The NAR reports: Existing-Home Sales Ease Following Four Monthly Gains
Existing-home sales – including single-family, townhomes, condominiums and co-ops – declined 2.7 percent to a seasonally adjusted annual rate1 of 5.10 million units in August from a pace of 5.24 million in July, but remain 3.4 percent above the 4.93 million-unit level in August 2008. In the previous four months, sales had risen a total of 15.2 percent.
...
Total housing inventory at the end of August fell 10.8 percent to 3.62 million existing homes available for sale, which represents an 8.5-month supply at the current sales pace, down from a 9.3-month supply in July. Unsold inventory totals are 16.4 percent lower than a year ago
 Click on graph for larger image in new window.
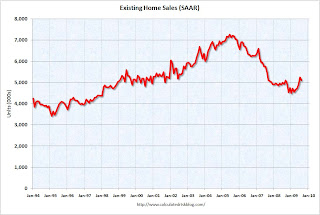
The first graph shows existing home sales, on a Seasonally Adjusted Annual Rate (SAAR) basis since 1993.
Sales in Aug 2009 (5.1 million SAAR) were 2.7% lower than last month, and were 3.4% higher than August 2008 (4.93 million SAAR).
Here is another way to look at existing homes sales: Monthly, Not Seasonally Adjusted (NSA):
 This graph shows NSA monthly existing home sales for 2005 through 2009. As in June and July, sales (NSA) were slightly higher in August 2009 than in August 2008.
It's important to note that many of these transactions are either investors or first-time homebuyers. Also many of the sales are distressed sales (short sales or REOs).
An NAR practitioner survey shows first-time buyers purchased 30 percent of homes in August, and that distressed homes accounted for 31 percent of transactions; both were unchanged from July.
 The third graph shows nationwide inventory for existing homes. According to the NAR, inventory decreased to 3.62 million in August. The all time record was 4.57 million homes for sale in July 2008. This is not seasonally adjusted.
Typically inventory peaks in July or August.
Note: many REOs (bank owned properties) are included in the inventory because they are listed - but not all. Recently there have been stories about a substantial number of unlisted REOs and other shadow inventory - so this inventory number is probably low.
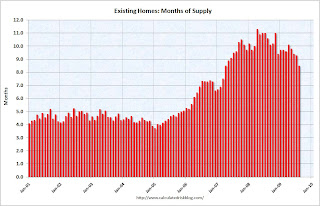
 The fourth graph shows the 'months of supply' metric for the last six years.
Months of supply was steady at 8.5 months.
Sales decreased, but inventory decreased more, so "months of supply" declined. A normal market has under 6 months of supply, so this is still very high.
Note: New Home sales will be released tomorrow.


