by Calculated Risk on 9/05/2009 07:25:00 PM
Saturday, September 05, 2009
When Will the Unemployment Rate hit 10%?
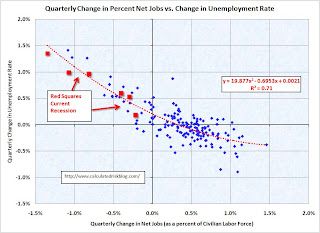
Although the unemployment rate is noisy month-to-month, we can use the graph and formula from Unemployment and Net Jobs to guess when the unemployment rate will reach 10%.
This graph from that previous posts shows the quarterly change in net jobs (on the x-axis) as a percentage of the civilian workforce, and the change in the unemployment rate on the y-axis.
The data is for the last 40 years: 1969 through Q2 2009. Click on graph for larger image in new window.
The Red squares are for 2008, and for the first two quarters of 2009.
The U-3 headline unemployment rate for August was reported at 9.7% (this is actually rounded up from 9.66%).
If net job losses average over 200 thousand per month, the unemployment rate will probably hit 10% in October.
If net job losses average 100 to 200 thousand per month, the unemployment rate will probably reach 10% in November.
With 50 thousand net job losses per month, it will probably take until December.
And if the economy averages zero net job losses per month, the unemployment rate will probably hit 10% in January or so.
These are just estimates - the series is noisy month-to-month - and it is possible the unemployment rate could hit 10% this month.
As I noted previously, this graph also suggests the economy needs to be adding about 0.33 percent of the civilian workforce per quarter to keep the unemployment rate from rising. That is about 170 thousand net jobs per month. Note: The civilian workforce in August was 154.6 million. 0.33% of 154.6 million is 510 thousand jobs per quarter or 170 thousand per month.
Note that the trend line is a 2nd order polynomial (equation on graph). When the economy starts to add jobs, more people start looking for work - and the relationship between net jobs and unemployment rate is not linear.


