by Calculated Risk on 12/23/2009 02:24:00 PM
Wednesday, December 23, 2009
Residential Investment: Moving Sideways
Weak new home sales and housing starts is both good and bad news.
One of the key economic problems right now is there are too many housing units1. This excess inventory includes a large number of single family homes, and a record number of vacant rental units. So fewer housing starts means population and household growth will absorb the excess housing units quicker. So weak new home sales and housing starts is good news for the housing market.
Unfortunately new home sales and housing starts are key drivers out of a recession for both GDP growth and employment. So weak new home sales and housing starts is bad news for the economy and employment.
Here is how it usually works: Housing leads the economy out of the recession, and more housing starts means more jobs, and that leads to more household formation, and that means more housing unit absorption - and that means more housing starts! A virtuous cycle.
However, with sluggish growth in housing starts, job growth will be sluggish, and that means slower housing unit absorption. A sluggish and choppy recovery. And I believe that is the current situation.
It was good news - for the economy - when housing starts and new home sales appeared to reach a bottom earlier this year. That meant the job losses in residential construction would slow and eventually stop.
However the "good" news for housing could only go so far until the huge overhang of existing homes and rental units is reduced. And now the news flow appears to be changing from positive housing news, to moving sideways (or even down).
I don't expect another plunge in housing starts or new home sales, but I think the recovery will be sluggish. And I also expect house prices to fall further, probably to new post-bubble lows nationally - although it is possible that the new lows will only be in real terms (not nominal). The good news on house prices is that most of the price correction is behind us on a national basis, however I expect some areas will still see significant price declines.
Here is a review of recent housing data showing the sluggish recovery (excluding existing home sales that have minimal impact on employment and the economy):
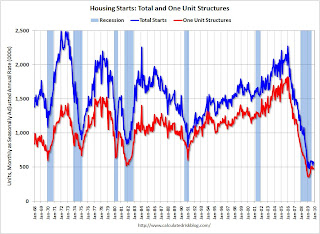
Housing Starts Click on graph for larger image in new window.
Housing starts are now moving sideways ...
Total housing starts were at 574 thousand (SAAR) in November, up 8.9% from the revised October rate, and up from the all time record low in April of 479 thousand (the lowest level since the Census Bureau began tracking housing starts in 1959). Starts had rebounded to 590 thousand in June, and have moved mostly sideways for six months.
Single-family starts were at 482 thousand (SAAR) in November, up 2.1% from the revised October rate, and 35 percent above the record low in January and February (357 thousand). Just like for total starts, single-family starts have been at this level for six months.
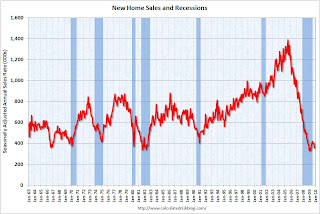
New Home Sales New Home sales are now moving sideways ...
The second graph shows New Home Sales vs. recessions for the last 45 years. New Home sales fell off a cliff, but after increasing slightly, are now only 8% above the low in January.
Sales of new one-family houses in November 2009 were at a seasonally adjusted annual rate of 355,000 ... This is 11.3 percent (±11.0%) below the revised October rate of 400,000 and is 9.0 percent (±15.3%)* below the November 2008 estimate of 390,000.Builder Confidence
 This graph shows the builder confidence index from the National Association of Home Builders (NAHB).
The housing market index (HMI) was at 16 in December. This is a decline from 17 in November. The record low was 8 set in January.
More moving sideways ...
Note: any number under 50 indicates that more builders view sales conditions as poor than good.
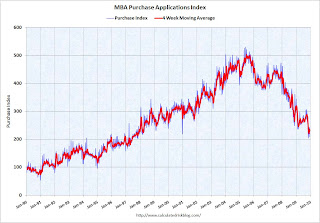
MBA Purchase Index
 This graph shows the MBA Purchase Index and four week moving average since 1990.
The four week average is close to a 12 year low, and has declined sharply over the last two months.
Although there is a large percentage of cash buyers now, the decline in the purchase application index suggests further weakness in home sales.
House Prices
LoanPerformance announced this week that house prices fell 0.7% in October.
Since most people have been following Case-Shiller (to be released next Tuesday), here is a graph of the LoanPerformance index (with and without foreclosures) and the Case-Shiller Composite 20 index.
 This graph shows the three indices with January 2000 = 100.
The indices mostly move together over time. Notice how the total LoanPerformance index fell further than the index excluding foreclosures - and also rebounded more.
The Case-Shiller index will probably show a decline in October too.
Residential Investment
Residential investment (mostly new home sales and home improvement) usually leads the economy out of a recession.
 This graph shows that Residential investment (RI) had declined for 14 consecutive quarters, and then increased slightly in Q3 2009.
Usually residential investment recovers quickly coming out of a recession. However look at the '90/'91 recession - residential investment recovered slowly, and so did employment (a jobless recovery). I expect the recovery in residential investment to be sluggish this time too. Note that the '01 recession was business led (the stock market bust).
1 The excess housing unit problem could be fixed by lower house prices and lower rents. Rents are now falling, and house prices have started falling again - so that will help.


