by Calculated Risk on 12/06/2009 12:00:00 PM
Sunday, December 06, 2009
Summary and a Look Ahead
Scheduled data for the coming week include the trade report (Thursday) and retail sales (Friday). Also the Treasury is expect to release the Making Home Affordable Program data for November this week and include additional metrics such as the number of permanent modifications and the number of failed trial modifications.
The number of permanent modifications is expected to be in the 10s of thousand.
Also, the Federal Reserve will release the Q3 Flow of Funds report on Thursday.
And a summary ...
The employment report showed a decline of 11,000 payroll jobs in November and a decline in the unemployment rate to 10.0% (from 10.2%). The smaller number of payroll jobs lost was surprising because other indicators (like the ADP report, weekly initial unemployment claims, ISM reports) suggested a larger number of job losses.
From Employment Report: 11K Jobs Lost, 10% Unemployment Rate.
 Click on graph for larger image.
This graph shows the job losses from the start of the employment recession, in percentage terms (as opposed to the number of jobs lost).
For the current recession, employment peaked in December 2007, and this recession is the worst recession since WWII in percentage terms, and 2nd worst in terms of the unemployment rate (only early '80s recession with a peak of 10.8 percent was worse).
Note: The total number of jobs lost does not include the preliminary benchmark payroll revision of minus 824,000 jobs. (This is the preliminary estimate of the annual revision that will be announced early in 2010).
From Seasonal Retail Hiring, Employment-Population Ratio, Part Time Workers
Retailers are hiring seasonal workers at slightly above the pace of last year ...
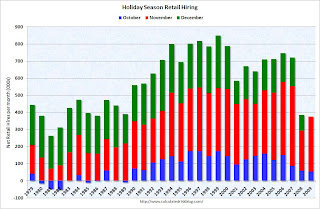
 Typically retail companies start hiring for the holiday season in October, and really increase hiring in November. Here is a graph that shows the historical net retail jobs added for October, November and December by year.
Retailers only hired 54.2 thousand workers (NSA) net in October. This was essentially the same as in 2008 (59.1 thousand NSA). However retailers hired 321.3 thousand workers in November (NSA), an increase from the 233.7 thousand last year. This suggests retailers are a little more optimistic than last year.
From Unemployment: Record number Unemployed over 26 Weeks, Diffusion Index
 The blue line is the number of workers unemployed for 27 weeks or more. The red line is the same data as a percent of the civilian workforce.
According to the BLS, there are a record 5.887 million workers who have been unemployed for more than 26 weeks (and still want a job). This is a record 3.8% of the civilian workforce. (note: records started in 1948)
Other Employment posts:
If the Economy lost Jobs, why did the Unemployment Rate decline?
Temporary Help
Manufacturing showed slower expansion: From the Institute for Supply Management: November 2009 Manufacturing ISM Report On Business®
Economic activity in the manufacturing sector expanded in November for the fourth consecutive month ...Services showed contraction: From the Institute for Supply Management: November 2009 Non-Manufacturing ISM Report On Business®
Economic activity in the non-manufacturing sector contracted in November after two consecutive months of expansion ...
 This graph shows private residential and nonresidential construction spending since 1993. Note: nominal dollars, not inflation adjusted.
Residential construction spending increased in October, and nonresidential spending continued to decline.
Private residential construction spending is now 63% below the peak of early 2006.
Private non-residential construction spending is 20.6% below the peak of last October.
 This graph shows the historical light vehicle sales (seasonally adjusted annual rate) from the BEA (blue) and an estimate for November (red, light vehicle sales of 10.93 million SAAR from AutoData Corp).
Obviously sales were boosted significantly by the "Cash-for-clunkers" program in August and some in July.
Excluding July and August, this was the strongest month since October 2008 (12.5 million SAAR) before sales fell off the final cliff.
The current level of sales are still very low, and are below the lowest point for the '90/'91 recession (even with a larger population).
Best wishes to all.From the American Bankruptcy Institute: November Consumer Bankruptcy Filings Drop 18 Percent from Previous Month HUD's Donovan: "Next Steps" for FHA Fed's Beige Book: Economy "improved modestly" Restaurant Index Shows Contraction in October Hotel RevPAR off 8.4 Percent Unofficial Problem Bank List, Dec 4, 2009


