by Calculated Risk on 12/27/2009 12:58:00 PM
Sunday, December 27, 2009
Weekly Summary and a Look Ahead
The key economic report this holiday week is the Case-Shiller house price index for October that will be released on Tuesday. The Case-Shiller index is actually an average for 3 months and the concensus is for further gains, although the house price index from LoanPerformance showed a decline in October.
In other economic news, the Chicago PMI will be released on Wednesday. Other recent regional indicators - the New York Fed's Empire State Manufacturing Survey and Richmond Fed’s Survey of Manufacturing Activity - have suggested a slowing in the manufacturing sector.
The monthly trucking and restaurant surveys will also be released this week.
And a summary of last week ...
The NAR reports: Another Big Gain in Existing-Home Sales as Buyers Respond to Tax Credit
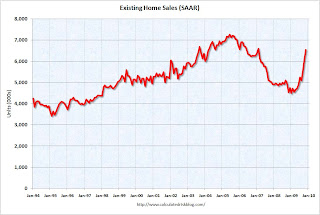
Existing-home sales – including single-family, townhomes, condominiums and co-ops – rose 7.4 percent to a seasonally adjusted annual rate of 6.54 million units in November from 6.09 million in October, and are 44.1 percent higher than the 4.54 million-unit pace in November 2008.
 Click on graph for larger image in new window.
This graph shows existing home sales, on a Seasonally Adjusted Annual Rate (SAAR) basis since 1993.
Sales in Nov 2009 (6.54 million SAAR) were 7.4% higher than last month, and were 44% higher than Nov 2008 (4.54 million SAAR).
Here is more on existing home sales.
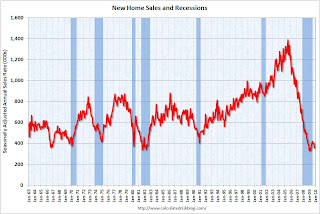
The Census Bureau reports New Home Sales in November were at a seasonally adjusted annual rate (SAAR) of 355 thousand. This is a sharp decrease from the revised rate of 400 thousand in October (revised down from 430 thousand).
 The second graph shows New Home Sales vs. recessions for the last 45 years. New Home sales fell off a cliff, but after increasing slightly, are now only 8% above the low in January.
 Sales of new one-family houses in November 2009 were at a seasonally adjusted annual rate of 355,000 ... This is 11.3 percent (±11.0%) below the revised October rate of 400,000 and is 9.0 percent (±15.3%)* below the November 2008 estimate of 390,000.See this post for more on New Home sales.
The following graph shows the ratio of existing home sales divided by new home sales through November.
 This ratio has increased again to a new all time high.
 The ratio of existing to new home sales increased at first because of the flood of distressed sales. This kept existing home sales elevated, and depressed new home sales since builders couldn't compete with the low prices of all the foreclosed properties.
The recent increase in the ratio was partially due to the timing of the first time homebuyer tax credit (before the extension) - and partially because the tax credit spurred existing home sales more than new home sales.
From commentary on home sales see: Residential Investment: Moving Sideways
From Bloomberg: U.S. Commercial Real Estate Index Falls 1.5%
Here is a comparison of the Moodys/REAL Commercial Property Price Index (CPPI) and the Case-Shiller composite 20 index.
 CRE prices only go back to December 2000.
The Case-Shiller Composite 20 residential index is in blue (with Dec 2000 set to 1.0 to line up the indexes).
CRE prices peaked in late 2007 and have fallen 44% from the peak and are now back to September 2002 levels.
Servicers can’t cancel an active Home Affordable trial modification scheduled to expire before Jan. 31 for any reason other than property eligibility requirements, according to a posting today on a government Web site.
The Treasury said it would provide capital as needed to Fannie Mae and Freddie Mac over the next three years, in a move aimed at soothing investors' concerns about the government's continued support of the mortgage giants.
Best wishes to all.


