by Calculated Risk on 1/25/2010 12:14:00 PM
Monday, January 25, 2010
More on Existing Home Sales
Earlier the NAR released the existing home sales data for December; here are a few more graphs ...  Click on graph for larger image in new window.
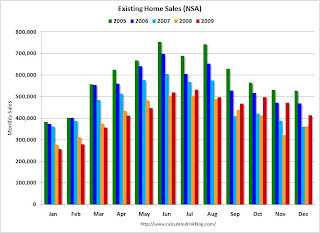
This graph shows NSA monthly existing home sales for 2005 through 2009 (see Red columns for 2009).
Sales (NSA) in December were much higher than in December 2007 and 2008.
The second graph shows existing home sales (left axis) through December, and new home sales (right axis) through November. The initial gap was caused by the flood of distressed sales. This kept existing home sales elevated, and depressed new home sales since builders couldn't compete with the low prices of all the foreclosed properties.
The recent spike in existing home sales was due primarily to the first time homebuyer tax credit.
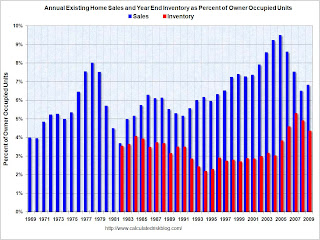
Eventually - when the housing market is more healthy - the ratio of existing to new home sales will probably return to the historical relationship. The third graph shows existing home sales and year end inventory as a percent of total owner occupied homes.
Both sales and inventory are above the normal range, although reported inventory has been declining for two years.
Both sales and inventory are being heavily impacted by government policies (boosting sales through tax credits and low mortgage rates, and limiting inventory through modification programs). There is probably a substantial "shadow inventory" that will come on the market, but the timing and size of the inventory are unknown.
The term "shadow inventory" is used in different ways. I consider all of the following to be "shadow inventory":
Probably the most important point to remember is that what matters for the economy and jobs is new home sales and residential investment. Until the excess housing inventory is reduced (both home and the rental units), new residential investment will be under pressure.REOs. There are bank owned properties that have not been put on the market yet. Foreclosures in process and seriously delinquent loans (although some of these may be in the modification process). New high rise condos. These properties are not included in the new home inventory report from the Census Bureau, and do not show up anywhere unless they are listed. Homeowners waiting for a better market. These are homeowners waiting for better market conditions to sell.


