by Calculated Risk on 1/22/2010 04:00:00 PM
Friday, January 22, 2010
Real House Prices, Price-to-Rent Ratio
Earlier First American CoreLogic reported that house prices declined in November. This is the Fed's favorite house price index. This post looks at real prices and the price-to-rent ratio, but first a look at the market ...Click on graph for larger image in new window.
This graph is from Doug Short of dshort.com (financial planner): "Four Bad Bears".
Note that the Great Depression crash is based on the DOW; the three others are for the S&P 500.
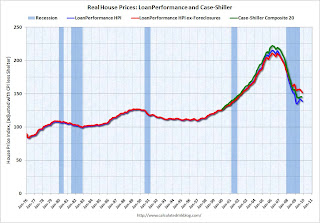
The second graph shows the First American CoreLogic LoanPerformance house price index through November (with and without foreclosures) and the Case-Shiller Composite 20 index through October in real terms (all adjusted with CPI less Shelter). It is interesting to look at the sharp decline in the index with foreclosures at the end of 2008 - this was what housing economist Tom Lawler described as "destickification" in the high foreclosure areas.
Notice the LoanPerformance price index without foreclosures (in red) is now at the lowest level since July 2002 in real terms (inflation adjusted).
This isn't like 2005 when prices were way out of the normal range by most measures - and it is possible that total national prices bottomed in 2009 (although I think prices will fall further), but prices ex-foreclosures probably still have a ways to go, even with all the government programs aimed at supporting house prices.
Price-to-Rent
In October 2004, Fed economist John Krainer and researcher Chishen Wei wrote a Fed letter on price to rent ratios: House Prices and Fundamental Value. Kainer and Wei presented a price-to-rent ratio using the OFHEO house price index and the Owners' Equivalent Rent (OER) from the BLS.
Here is a similar graph through November 2009 using the First American CoreLogic LoanPerformance House Price Index: This graph shows the price to rent ratio (January 2000 = 1.0).
This suggests that house prices are still a little too high on a national basis. Also rents are still falling and the OER index tends to lag market rents by a few months. And that will push up the price-to-rent ratio, putting more pressure on house prices.


