by Calculated Risk on 1/23/2010 04:46:00 PM
Saturday, January 23, 2010
Update on Residential Investment
This is an update of some graphs in a post last month: Residential Investment: Moving Sideways.
Housing Starts Click on graph for larger image in new window.
Housing starts are still moving sideways ...
Total housing starts were at 557 thousand (SAAR) in December, down 4.0% from the revised November rate, and up 16% from the all time record low in April of 479 thousand (the lowest level since the Census Bureau began tracking housing starts in 1959). Starts had rebounded to 590 thousand in June, and have moved mostly sideways for seven months.
Single-family starts were at 456 thousand (SAAR) in December, down 6.9% from the revised November rate, and 28 percent above the record low in January and February (357 thousand). Just like for total starts, single-family starts have been at around this level for seven months.
Builder Confidence This graph shows the builder confidence index from the National Association of Home Builders (NAHB).
This graph shows the builder confidence index from the National Association of Home Builders (NAHB).
The housing market index (HMI) was at 15 in January. This is a decrease from 16 in December and 17 in November.
More moving sideways ... (or down!)
Note: any number under 50 indicates that more builders view sales conditions as poor than good.
MBA Purchase Index This graph shows the MBA Purchase Index and four week moving average since 1990.
The four week moving average has declined sharply since October, and is slightly above the 12 year low set last week.
Although there are more cash buyers now (all the investor buying), this suggests further weakness in home purchases.
House Prices
LoanPerformance reported yesterday that house prices fell again in November.
Most people follow the Case-Shiller index (to be released next Tuesday), but the Fed uses the First American CoreLogic LoanPerformance House Price Index (HPI). This graph shows the three indices with January 2000 = 100.
The index is off 5.7% over the last year, and off 30.0% from the peak.
The index has declined for three consecutive months.
The Case-Shiller might show a decline in November too, but it is a 3 month average, so the decline might not show up until December.
For more graphs, here are real prices and the price-to-rent ratio using the LoanPerformance HPI.
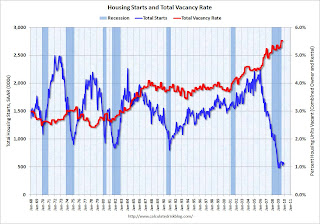
Vacant Housing Units The following graph shows total housing starts and the percent vacant housing units (owner and rental) in the U.S. Note: this is a combined vacancy rate based on the Census Bureau vacancy rates for owner occupied and rental housing through Q3 2009 (Q4 will be released in early February).
As I've noted several times, it is difficult to see a robust recovery without a recovery in residential investment. And it is hard to imagine a strong recovery in residential investment until the huge overhang of excess housing units are absorbed.
I don't expect another plunge in housing starts or new home sales, but as long as these indicators are moving sideways - or just recovering modestly - I think the economic recovery will be sluggish.


