by Calculated Risk on 2/17/2010 06:45:00 PM
Wednesday, February 17, 2010
Q4: Quarterly Housing Starts and New Home Sales
This morning the Census Bureau has released the "Quarterly Starts and Completions by Purpose and Design" report for Q4 2009.
Monthly housing starts (even single family starts) cannot be compared directly to new home sales, because the monthly housing starts report from the Census Bureau includes apartments, owner built units and condos that are not included in the new home sales report.
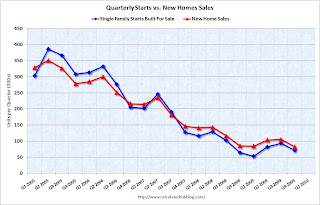
However it is possible to compare "Single Family Starts, Built for Sale" to New Home sales on a quarterly basis. The quarterly report shows that there were 71,000 single family starts, built for sale, in Q4 2009, and that is less than the 82,000 new homes sold for the same period. This data is Not Seasonally Adjusted (NSA).
This is the 9th consecutive quarter with homebuilders selling more homes than they start.
Note: new home sales are reported when contracts are signed, so it is appropriate to compare sales to starts (as opposed to completions). This is not perfect because homebuilders do build spec homes and many builders were stuck with some “unintentional spec homes” because of cancellations during the bust. Click on graph for larger image in new window.
This graph provides a quarterly comparison of housing starts and new home sales. In 2005, and most of 2006, starts (blue) were higher than sales (red), and inventories of new homes increased. For the last 9 quarters, starts have been below sales – and new home inventories have been falling. The second graph shows the NSA quarterly starts intent for four categories since 1975: single family built for sale, owner built (includes contractor built for owner), starts built for rent, and condos built for sale.
Condo starts in Q4 were at an all time record low of 3,000 condos built for sale. This breaks the record set in Q1, Q2 and Q3 of 2009 of 5,000 condos per quarter. The previous record was 8,000 set in Q1 1991 (data started in 1975). Only 18,000 condos were started in 2009, far below the previous low of 41,000 in 1991.
Units built for rent set an all time record low in Q4 (19,000 units in Q4 2009 compared to the previous record low of 21,000 units in Q1 1993). With the vacancy rate at a record high, the demand for new rental units will stay low for some time.
Owner built units are above the record low set in Q1 2009 (31,000 units compared to 24,000 units in Q1 2009), however the pickup in owner built starts was probably mostly seasonal (this is NSA data).
And the largest category - starts of single family units, built for sale - was very low at 71,000 units in Q4.
With starts so low in every category, the number of units added to the housing stock in 2010 will be at a record low - and that will help reduce the significant excess inventory of housing units.


