by Calculated Risk on 2/09/2010 09:17:00 PM
Tuesday, February 09, 2010
Rail Traffic Flat in January Compared to 2009
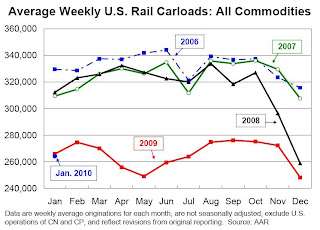
From the Association of American Railroads: Rail Time Indicators. The AAR reports traffic in January 2010 was down 0.7% compared to January 2009. Click on graph for larger image in new window.
This graph shows U.S. average weekly rail carloads. It is important to note that excluding coal, traffic is up 11.3% from January 2009, and traffic increased in 13 of the 19 major commodity categories.
Housing: In addition to the decline in coal, two key building materials were also down YoY from January 2009: Forest products (off 27.0%) and Nonmetallic minerals & prod. (crushed stone, gravel, sand was off 16.6%). This fits with the recent data on housing starts, new home sales, and the NAHB home builder index that shows residential investment is flat and non-residential investment is declining sharply.
From AAR:
• U.S. freight railroads originated 1,056,684 carloads in January 2010, an average of 264,171 carloads per week — down 0.7% from January 2009 (265,983 average) and down 17.7% from January 2008’s 321,040 average.
• Carloads excluding coal were up 11.3% (58,467 carloads) in January 2010 from January 2009, though they were still down 19.9% from January 2008.
• In January 2010, 13 of the 19 major commodity categories tracked by the AAR saw carload gains compared with January 2009. Carloads of chemicals were up 13.2% from last year, while carloads of primary metal products (predominantly steel) were up 28.0%.
• The biggest carload percentage gain in January 2010 went to motor vehicles and parts, carloads of which were up 65.7% in January 2010 from January 2009’s severely depressed level.
emphasis added


