by Calculated Risk on 3/21/2010 05:03:00 PM
Sunday, March 21, 2010
Oil Prices and Vehicle Miles
Something for a Sunday - in the weekly look ahead post I forgot to mention that the Department of Transportation (DOT) will release the vehicle miles driven report for January this week.
In early 2008 there was sharp drop in U.S. vehicle miles driven and that was one of the key signs of demand destruction for oil that led me to predict oil prices would decline sharply in the 2nd half of 2008.
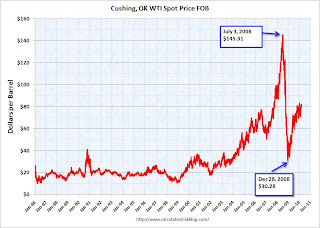
First a look at oil prices ... Click on graph for larger image in new window.
This graph shows the daily Cushing, OK WTI Spot Price FOB from the Energy Information Administration (EIA).
With oil prices hoovering around $80 per barrel, I've started looking for possible signs of demand destruction again (see: Oil Prices Push Above $81 per Barrel). Of course there are other factors - like China - but vehicle miles is something to watch in the U.S. The second graph shows monthly oil prices and vehicle miles (month over the same month of the previous year with a 3 month centered average).
Although vehicle miles driven are noisy month to month, it appear that miles driven responds to spikes in oil prices.
For December 2009 - the last month of data - the DOT reported that miles driven were unchanged compared to December 2008 after increasing in 5 of the 6 pervious months. This slow down in miles driven could be because of the sluggish recovery, or it could be because oil prices are starting to impact miles driven.


