by Calculated Risk on 3/14/2010 12:03:00 PM
Sunday, March 14, 2010
Weekly Summary and a Look Ahead
This will be a busy week with two key housing reports released on Monday and Tuesday: Builder confidence and Housing starts.
On Monday, the Fed will release the February Industrial Production and Capacity Utilization report at 9:15 AM ET. Expectations are for no increase in industrial production, and a slight decrease in capacity utilization (snow related).
Also on Monday, the NAHB will release the Housing Market Index of builder confidence for March at 1:00 PM ET (little change expected - still depressed), and the Empire Manufacturing Survey will be released at 8:30 AM.
On Tuesday, the Census Bureau will release Housing Starts for February at 8:30 AM ET. There will probably be a small decline in February starts because of the snow, however housing starts have already been moving sideways since last June as the excess inventory of housing units has slowly been absorbed.
Also on Tuesday, the FOMC statement will be released at 2:15 PM ET. Obviously there will be no change to the federal funds rate, but the statement might be a little more positive on the economy. The key wording -"exceptionally low levels of the federal funds rate for an extended period" - will almost certainly remain the same. The Fed will probably discuss planning for an "exit strategy" and the end of the MBS purchase program at the end of March.
On Wednesday, the MBA Mortgage Applications Index, and the Producer Price index for February will both be released.
On Thursday, the closely watched initial weekly unemployment claims, and the February Consumer Price Index (consensus is for a 0.1% increase - subdued inflation) will be released. Of special interest will be the Owners' Equivalent Rent index that has been declining for several months.
Also on Thursday, the March Philly Fed survey will be released.
On Friday the FDIC will probably close several more banks. I'm still expecting some activity in Puerto Rico soon, and the Chicago Tribune reported this week that bids are being taken on several banks in the Chicago area:
The Federal Deposit Insurance Corp. is putting at least a half-dozen struggling Chicago-area banks out for bid to healthy institutions that might want to buy their deposits and asset.On Saturday, Fed Chairman Ben Bernanke will be speaking at the Community Bankers convention in Florida.
...
People familiar with the FDIC process say that, among the undercapitalized banks, those that the regulator is trying to line up buyers for include Amcore Bank, Broadway Bank, Lincoln Park Savings Bank, Wheatland Bank, Citizens Bank & Trust Co. of Chicago and New Century Bank.
And a summary of last week ...
On a monthly basis, retail sales increased 0.3% from January to February (seasonally adjusted, after revisions), and sales were up 4.5% from February 2009 (easy comparison). However January was revised down sharply from a 0.5% increase to 0.1%.
 Click on graph for larger image in new window.
This graph shows retail sales since 1992. This is monthly retail sales, seasonally adjusted (total and ex-gasoline).
The red line shows retail sales ex-gasoline and shows the increase in final demand ex-gasoline has been sluggish.
Retail sales are up 6.0% from the bottom, but still off 6.4% from the peak. Retail ex-gasoline are up 3.6% from the bottom and still off 5.4% from the peak.
The second graph shows the U.S. trade deficit, with and without petroleum, through January.
 The Census Bureau reports:
 [T]otal January exports of $142.7 billion and imports of $180.0 billion resulted in a goods and services deficit of $37.3 billion, down from $39.9 billion in December, revised.The blue line is the total deficit, and the black line is the petroleum deficit, and the red line is the trade deficit ex-petroleum products.
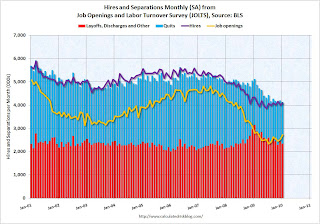
The following graph shows job openings (yellow line), hires (purple Line), Quits (light blue bars) and Layoff, Discharges and other (red bars) from the BLS JOLTS report. Red and light blue added together equals total separations.
 According to the JOLTS report, there were 4.08 million hires in January (SA), and 4.122 million total separations, or 42 thousand net jobs lost. The comparable CES report showed a loss of 26 thousand jobs in January (after revision).
Separations have declined sharply from early 2009, but hiring has barely picked up. Quits (light blue on graph) are at near the low too. Usually "quits" are employees who have already found a new job (as opposed to layoffs and other discharges).
The low turnover rate is another indicator of a weak labor market.
 This graph shows the high and low unemployment rates for each state (and D.C.) since 1976. The red bar is the current unemployment rate (sorted by the current unemployment rate).
Fifteen states and D.C. now have double digit unemployment rates. New Jersey and Indiana are close.
Five states and D.C. set new series record highs: California, South Carolina, Florida, Georgia and North Carolina. Two other states tied series highs: Nevada and Rhode Island.
Best wishes to all.


