by Calculated Risk on 3/21/2010 12:30:00 PM
Sunday, March 21, 2010
Weekly Summary and a Look Ahead
There will be two key housing reports released this week (existing home sales on Tuesday and new home sales on Wednesday) and plenty of Fed speeches ...
On Monday, the Chicago Fed will release the February Chicago Fed National Activity Index at 8:30 AM ET. Activity in February was probably sluggish. Also on Monday, Treasury Secretary Tim Geithner will speak at the American Enterprise Institute (4:30 PM ET), and Atlanta Fed President Dennis Lockhart will speak in the evening in Florida.
Probably early this week, the Moody's/REAL Commercial Property Price Indices (CPPI) for January will be released. This is a repeat sales price index for Commercial Real Estate (CRE).
On Tuesday, Existing Home sales for February will be released by the National Association of Realtors (NAR) at 10 AM ET. Expectations are for a slight decrease in sales to a 5 million Seasonally Adjusted Annual Rate (SAAR). I’ll take the under. The Census Bureau will also release the Mass Layoffs report for February on Tuesday.
Also on Tuesday the FHFA House Price Index for January will be released (this has been ignored recently), the Richmond Fed Survey (March) at 10 AM ET, and San Francisco Fed President Janet Yellen will speak at 3:35 PM ET. It is widely reported that Yellen will be nominated to be the next Fed Vice Chairman.
On Wednesday the American Institute of Architects’ February Architecture Billings Index will be released - a leading indicator for Commercial Real Estate (CRE). This has been showing significant weakness for some time.
Also on Wednesday, the New Home sales report from the Census Bureau will be released at 10 AM ET. The consensus is for some increase from the record low set in January (309 thousand SAAR), but the number will still be very low. Sales have averaged 370 thousand (SAAR) over the last 12 months, and February will be well below that level.
Also on Wednesday, the weekly MBA mortgage purchase applications index will be released (7 AM ET) and the Durable Goods report for February at 10 AM ET.
There will be more Fed speak on Wednesday: the FOMC’s lone dissenter, Kansas Fed President Thomas Hoenig, speaks at 10:45 AM ET, and outgoing Fed Vice Chairman Donald Kohn speaks at 8 PM ET.
On Thursday, the closely watched initial weekly unemployment claims will be released. Also the Census Bureau will released the Regional and State Employment and Unemployment for February at 10 AM ET.
Cleveland Fed President Sandra Pianalto speaks at 9 AM ET, and Fed Chairman Ben Bernanke testifies before the House Financial Services Committee at 10 AM ET.
On Friday the 3rd estimate of Q4 GDP released (any change will be minor), and the Reuter's/University of Michigan's Consumer sentiment index for March will be released at 9:55 AM ET (consensus is for a slight increase to 73 from 72.5).
Also on Friday the FDIC will probably close several more banks. I think this is the week for Puerto Rico!
And a summary of last week ...
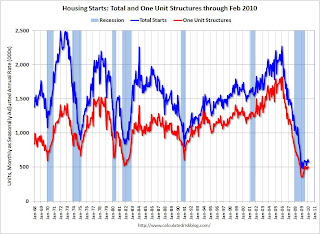
 Click on graph for larger image in new window.
Total housing starts were at 575 thousand (SAAR) in February, down 5.9% from the revised January rate, and up 20% from the all time record low in April 2009 of 479 thousand (the lowest level since the Census Bureau began tracking housing starts in 1959). Starts had rebounded to 590 thousand in June, and have moved mostly sideways for nine months.
Single-family starts were at 499 thousand (SAAR) in February, down 0.6% from the revised January rate, and 40% above the record low in January and February 2009 (357 thousand). Just like for total starts, single-family starts have been at about this level for nine months.
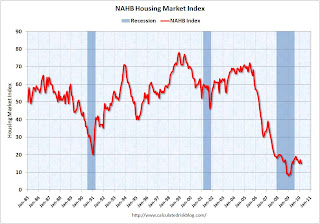
Note: any number under 50 indicates that more builders view sales conditions as poor than good.
 This graph shows the builder confidence index from the National Association of Home Builders (NAHB).
The housing market index (HMI) was at 15 in March. This is a decrease from 17 in February.
The record low was 8 set in January 2009. This is very low - and this is what I've expected - a long period of builder depression.
 From the Fed: "Industrial production edged up 0.1 percent in February following a gain of 0.9 percent in January. ... Capacity utilization for total industry moved up 0.2 percentage point to 72.7 percent, a rate 7.9 percentage points below its average from 1972 to 2009."
This graph shows Capacity Utilization. This series is up 6.5% from the record low set in June (the series starts in 1967).
Capacity utilization at 72.7% is still far below normal - and far below the the pre-recession levels of 80.5% in November 2007.
The Fed's favorite house price indicator from First American CoreLogic’s LoanPerformance ...
 From LoanPerformance: "On a month-over-month basis, the national average home price index decline accelerated, falling by 1.9 percent in January 2010 compared to 0.8 percent in December 2009, indicating the housing market still remains weak."
This graph shows the national LoanPerformance data since 1976. January 2000 = 100.
The index is off 0.7% over the last year, and off 29% from the peak.
The index has declined for five consecutive months.
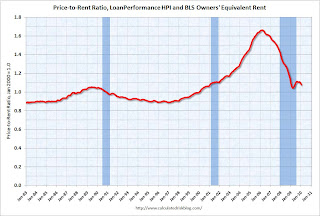
Here is an update on the price-to-rent ratio using the First Amercican CoreLogic house price index and the Owners' Equivalent Rent (OER) from the BLS.
 This graph shows the price to rent ratio (January 2000 = 1.0).
 This suggests that house prices are still a little too high on a national basis. But it does appear that prices are much closer to the bottom than the top.
Also, OER declined slightly again in February. The price index has declined 6 of the last 8 months, although most of the declines have been very small. With rents still falling, the OER index will probably continue to decline - pushing up the price-to-rent ratio.
Best wishes to all.


