by Calculated Risk on 5/24/2010 08:30:00 AM
Monday, May 24, 2010
Chicago Fed: Economic Activity increased in April
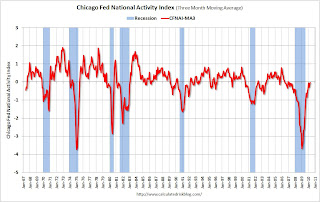
Note: This is a composite index based on a number of economic releases. This shows that growth in April was still slightly below trend (weak for a recovery).
From the Chicago Fed: Index shows economic activity continued to improve in April
Led by continued improvements in production- and employment-related indicators, the Chicago Fed National Activity Index increased to +0.29 in April, up from +0.13 in March. April marked the highest level of the index since December 2006 and the third time in the past four months that the index indicated above-average economic activity. Three of the four broad categories of indicators that make up the index made positive contributions in April, while the consumption and housing category made the lone negative contribution.
The index’s three-month moving average, CFNAI-MA3, increased to –0.03 in April from –0.09 in March, reaching its highest level since February 2007. April’s CFNAI-MA3 suggests that growth in national economic activity was very near its historical trend. With the index still slightly below trend, there remains some economic slack, suggesting subdued inflationary pressure from economic activity over the coming year.
 Click on table for larger image in new window.
This graph shows the Chicago Fed National Activity Index (three month moving average) since 1967. According to the Chicago Fed:
A zero value for the index indicates that the national economy is expanding at its historical trend rate of growth; negative values indicate below-average growth; and positive values indicate above-average growth.We are now about 10+ months into the recovery, and growth by most indicators is still slightly below trend.


