 RSS Feed
 by Calculated Risk on 5/07/2010 12:51:00 PM
Friday, May 07, 2010
Temporary Help and Diffusion Index
Here are a couple more graphs based on data in the employment report ...
Temporary Help
From the BLS report:
Temporary help services continued to add jobs (26,000); employment in this industry has increased by 330,000 since September 2009.
 This graph is a little complicated. The red line is the three month average change in temporary help services (left axis). This is shifted four months into the future.
The blue line (right axis) is the three month average change in total employment (excluding temporary help services).
Unfortunately the data on temporary help services only goes back to 1990, but it does appear that temporary help leads employment by about four months.
The thinking is that before companies hire permanent employees following a recession, employers will first increase the hours worked of current employees (hours worked increased slightly in April) and also hire temporary employees. Since the number of temporary workers increased sharply over the last seven months, some people think this might be signaling the beginning of a strong employment recovery.
However, there has been some evidence of a shift by employers to more temporary workers, and the saying may become "We are all temporary now!", so use this increase with caution.
Note that the temporary hiring for the Census is excluded from this graph.
Diffusion Index
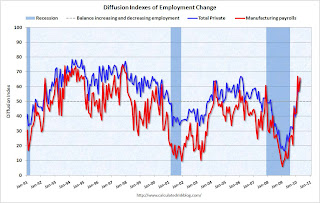 The BLS diffusion index for total private employment increased to 64.3 from 57.8 in March. This is the highest level since 2006. For manufacturing, the diffusion index is at 65.9; the highest since 1998.
Think of this as a measure of how widespread job gains are across industries. The further from 50 (above or below), the more widespread the job losses or gains reported by the BLS. From the BLS:
Figures are the percent of industries with employment increasing plus one-half of the industries with unchanged employment, where 50 percent indicates an equal balance between industries with increasing and decreasing employment.This fits with the headline payroll report and is a positive.
Earlier employment posts today:


