by Calculated Risk on 9/01/2010 10:15:00 AM
Wednesday, September 01, 2010
Construction Spending declines in July
Note: the ISM PMI increased to 56.3 from 55.5 in July (I'll have more later).
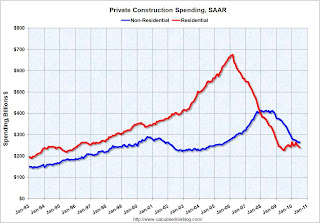
Overall construction spending decreased in July. Click on graph for larger image in new window.
This graph shows private residential and nonresidential construction spending since 1993. Note: nominal dollars, not inflation adjusted.
From the Census Bureau: July 2010 Construction at $805.2 Billion Annual Rate
The U.S. Census Bureau of the Department of Commerce announced today that construction spending during July 2010 was estimated at a seasonally adjusted annual rate of $805.2 billion, 1.0 percent (±1.4%)* below the revised June estimate of $813.1 billion. The July figure is 10.7 percent (±1.8%) below the July 2009 estimate of $901.2 billion.Private residential construction spending has turned down again - after the tax credit expired - and residential investment (RI) will be a drag on Q3 GDP. The "good" news is the overall drag from RI will be much smaller than during 2006, 2007 and 2008.
...
Spending on private construction was at a seasonally adjusted annual rate of $506.4 billion, 0.8 percent (±1.3%)* below the revised June estimate of $510.7 billion. Residential construction was at a seasonally adjusted annual rate of $240.3 billion in July, 2.6 percent (±1.3%) below the revised June estimate of $246.7 billion. Nonresidential construction was at a seasonally adjusted annual rate of $266.1 billion in July, 0.8 percent (±1.3%)* above the revised June estimate of $264.0billion.


