 RSS Feed
 by Calculated Risk on 10/03/2010 09:34:00 AM
Sunday, October 03, 2010
Summary for Week ending Oct 2nd
Here is a summary of last week - mostly in graphs.
During the previous week, a number of Fed Presidents spoke about further easing (what is known as QE2: quantitative easing, round two). The majority seemed to favor taking additional action - probably purchasing longer term Treasury securities. Barring an upside surprise in the economic data, most analysts expect QE2 to arrive at 2:15 PM ET on November 3rd (when the next FOMC statement is released).
Another story was the "robo-signer" foreclosure mess that has led to GMAC, JPMorgan and BofA halting or reviewing foreclosure filings - and for some insurance companies to stop offering title insurance on related foreclosures.
There are links to other stories at the bottom of this post.
Based on an estimate from Autodata Corp, light vehicle sales were at a 11.76 million SAAR in Setpember. That is up 25.8% from September 2009 (the dip following cash-for-clunkers), and up 2.8% from the August 2010 sales rate.
 Click on graph for larger image in new window.
This graph shows the historical light vehicle sales (seasonally adjusted annual rate) from the BEA (blue) and an estimate for August (red, light vehicle sales of 11.76 million SAAR from Autodata Corp).
This is the high for the year - slightly higher than in March.
 The second graph shows light vehicle sales since the BEA started keeping data in 1967.
Note: dashed line is current month sales rate. The current sales rate is about at the bottom of the '90/'91 recession - when there were fewer registered drivers and a smaller population.
This was above most forecasts of around 11.6 million SAAR.
From S&P: Home Prices Remain Stable Around Recent Lows According to the S&P/Case-Shiller Home Price Indices
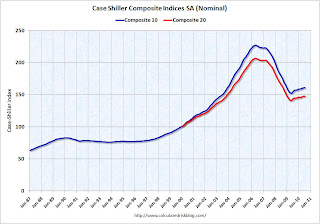 This graph shows the nominal seasonally adjusted Composite 10 and Composite 20 indices (the Composite 20 was started in January 2000).
The Composite 10 index is off 29.0% from the peak, and flat in July (SA).
The Composite 20 index is off 28.6% from the peak, and down 0.1% in July (SA).
The next graph shows the price declines from the peak for each city included in S&P/Case-Shiller indices.
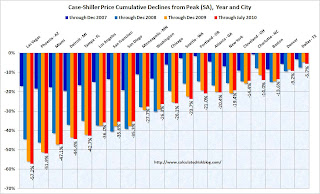 Prices increased (SA) in only 4 of the 20 Case-Shiller cities in July seasonally adjusted.
Prices in Las Vegas are off 57.2% from the peak, and prices in Dallas only off 5.7% from the peak.
Prices probably declined just about everywhere in July, but this will not be evident in the Case-Shiller index until next month since the Case-Shiller index is an average of three months.
From the BEA: Personal Income and Outlays, August 2010
Personal income increased $59.3 billion, or 0.5 percent ... Personal consumption expenditures (PCE) increased $41.3 billion, or 0.4 percent.
...
Real PCE increased 0.2 percent, the same increase as in July.
...
Personal saving as a percentage of disposable personal income was
5.8 percent in August, compared with 5.7 percent in July.
 This graph shows monthly real PCE since Q4 2009. the dashed red lines are the quarterly PCE (note: left scale doesn't start at zero to show the change).
The key in this report is that real PCE growth in Q3 will probably be around 2.0% annualized - barring a significant change in September. This suggests sluggish, but positive GDP growth in Q3.
PMI at 54.4% in September down from 56.3% in August.
From the Institute for Supply Management: September 2010 Manufacturing ISM Report On Business®
 Here is a long term graph of the ISM manufacturing index.
In addition to the decrease in the PMI, the ISM's new orders index fell to 51.1 from 53.1 in August, and the production index declined to 56.5 from 59.9.
The employment index declined to 56.5 from 60.4 in August.
And the inventory index was up for the 3rd month in a row to 55.6 from 51.4.
With new order growth slowing, and inventory increasing - further declines in the ISM PMI are very likely. As ISM's Norbert Ore noted, these indexes are "sending strong negative signals of weakening performance in the [manufacturing] sector".
The Census Bureau reported overall construction spending increased slightly in August.
 This graph shows private residential and nonresidential construction spending since 1993. Note: nominal dollars, not inflation adjusted.
Both residential and non-residential private construction spending declined in August. Residential spending is 64.7% below the peak early 2006, and 4.7% above the recent low in 2009.
Non-residential spending is 37.3% from the peak in January 2008.
Residential spending has turned slightly negative after the tax credit expired - and this indicates residential investment (RI) will be a drag on Q3 GDP.
Best wishes to all.


