by Calculated Risk on 11/22/2010 09:21:00 AM
Monday, November 22, 2010
CoreLogic: Shadow Housing Inventory pushes total unsold inventory to 6.3 million units
From CoreLogic: Shadow Inventory Jumps More Than 10 Percent in One Year, Pushing Total Unsold Inventory to 6.3 Million Units

This graph from CoreLogic shows the breakdown of "shadow inventory" by category. For this report, CoreLogic estimates the number of 90+ day delinquencies, foreclosures and REOs not currently listed for sale. Obviously if a house is listed for sale, it is already included in the "visible supply" and cannot be counted as shadow inventory.
CoreLogic estimates the "shadown inventory" (by this method) at about 2.1 million units.
CoreLogic estimates shadow inventory, sometimes called pending supply, by calculating the number of properties that are seriously delinquent (90 days or more), in foreclosure and real estate owned (REO) by lenders and that are not currently listed on multiple listing services (MLSs). Shadow inventory is typically not included in the official metrics of unsold inventory.
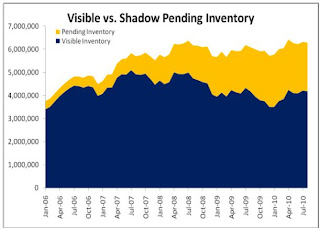
According to CoreLogic, the visible supply of unsold inventory was 4.2 million units in August 2010, the same as the previous year. The visible inventory measures the unsold inventory of new and existing homes that were on the market. The visible months’ supply increased to 15 months in August, up from 11 months a year earlier due to the decline in sales during the last few months.
The total visible and shadow inventory was 6.3 million units in August, up from 6.1 million a year ago. The total months’ supply of unsold homes was 23 months in August, up from 17 months a year ago. Although it can vary and it depends on the market and real estate cycle, typically a reading of six to seven months is considered normal so the current total months’ supply is roughly three times the normal rate.
...
Mark Fleming, chief economist for CoreLogic commented, “The weak demand for housing is significantly increasing the risk of further price declines in the housing market. This is being exacerbated by a significant and growing shadow inventory that is likely to persist for some time due to the highly extended time-to-liquidation that servicers are currently experiencing.”
 The second graph from CoreLogic shows the total visible and pending inventory. Even though the visible inventory has declined slightly from the peak in 2007, the total inventory is at close to an all time high of 6.3 million units.
Note: The term "shadow inventory" is used in many different ways. My definition is: housing units that are not currently listed on the market, but will probably be listed soon. This includes:
Although the CoreLogic report is useful in estimating future supply, I think it is the visible supply that impacts prices.


