by Calculated Risk on 12/27/2010 01:16:00 PM
Monday, December 27, 2010
Question #6 for 2011: Unemployment Rate
A week ago I posted some questions for next year: Ten Economic Questions for 2011. I'm working through the questions and trying to add some predictions, or at least some thoughts for each question before the end of year.
6) Unemployment Rate: The post-Depression record for consecutive months with the unemployment rate above 9% was 19 months in the early '80s. That record will be broken this month, and it is very possible that the unemployment rate will still be above 9% in December 2011. This high level of unemployment - and the number of long term unemployed - is an economic tragedy. The economy probably needs to add around 125 thousand payroll jobs per month just to keep the unemployment rate from rising (payroll jobs and unemployment rate come from two different surveys, so there is no perfect relationship, and the rate also depends on the participation rate). What will the unemployment rate be in December 2011?
First, here is a graph showing the current unemployment rate (red) and the participation rate (blue). The unemployment rate depends both on job creation and the labor force participation rate.
 Click on graphs for large images in graphics gallery.
The unemployment rate is currently at 9.8%, and the Labor Force Participation Rate (blue) was at 64.5% in November. This is the percentage of the working age population in the labor force.
Although I expect the participation rate to decline over the next couple of decades as the population ages, I think the participation rate will rise over the next few years - perhaps as high as 66%.
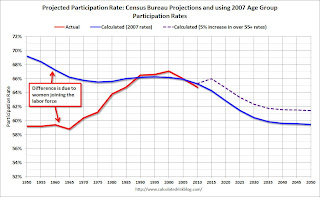
The following graph is a projection from a previous post: Labor Force Participation Rate: What will happen?
 This graph uses the participation rates by age group for 2007, and historical data and age group population projections from the Census Bureau, to calculate a participation rate based on demographics.
This graph shows the calculated participation rate (blue) through 2050, and the actual participation rate since 1950 (red). The calculated participation rate, using 2007 data, is far too high for the earlier periods. This is mostly because of women joining the labor force.
Without other shifts in the labor force, the blue line would indicate the participation rate over the next 40 years. The dashed purple line indicates the participation rate with a 5 percentage point increase in the 'over 55' labor force participation rate - something that appears likely.
If the participation rate does increases - say to 65% over the next year, from the current 64.5% - then the U.S. economy will need an additional 1 million jobs just to hold the unemployment rate steady (not counting population growth). Add in 125,000 per month more jobs to offset population growth, and the economy would have to add 2.5 million jobs in 2011 to hold the unemployment rate steady (assuming a 0.5 percentage point increase in the participation rate). This suggests any decline in the unemployment rate will be slow.
Another way to look at the unemployment rate is using Okun's Law.
 This graph uses a version of Okun's law showing the annual change in real GDP (x-axis) vs. the annual change in the unemployment rate (y-axis) through Q3 2010.
Note: For this graph I used a rolling four quarter change - so all the data points are not independent. However - remember - this "law" is really just a guide.
The following table summarizes several scenarios over the next year using this relationship (starting from the current 9.8% unemployment rate):
| Real GDP Growth | Unemployment Rate in One Year |
|---|---|
| 0.0% | 11.2% |
| 1.0% | 10.7% |
| 2.0% | 10.2% |
| 3.0% | 9.8% |
| 4.0% | 9.3% |
| 5.0% | 8.9% |
| 6.0% | 8.3% |
Back in November, I took the "over" on GDP growth in 2011. Since then most forecasts have been revised up, but using this graph, real GDP growth would probably have to be above about 3% to see a reduction in the unemployment rate.
Although I'm still looking at GDP and employment for 2011, I think the unemployment rate will decline - but slowly. A couple of predictions.
• The participation rate will rise in 2011, perhaps to 65%.
• The unemployment rate will fall in 2011, but probably still be above 9% in December 2011 (I hope this is way too pessimistic).
Ten Questions:
• Question #1 for 2011: House Prices
• Question #2 for 2011: Residential Investment
• Question #3 for 2011: Delinquencies and Distressed house sales
• Question #4 for 2011: U.S. Economic Growth
• Question #5 for 2011: Employment
• Question #6 for 2011: Unemployment Rate
• Question #7 for 2011: State and Local Governments
• Question #8 for 2011: Europe and the Euro
• Question #9 for 2011: Inflation
• Question #10 for 2011: Monetary Policy


