by Calculated Risk on 1/07/2011 10:01:00 AM
Friday, January 07, 2011
Employment Summary and Part Time Workers, Unemployed over 26 Weeks
Here are a few more graphs based on the employment report ...
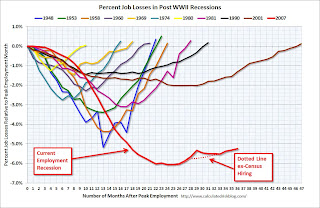
Percent Job Losses During Recessions
 Click on graph for larger image.
This graph shows the job losses from the start of the employment recession, in percentage terms - this time from the start of the recession.
In the previous post, the graph showed the job losses aligned at the bottom.
The dotted line shows payroll employment excluding temporary Census workers.
This is by far the worst post WWII employment recession.
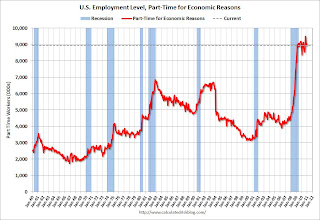
Part Time for Economic Reasons
 From the BLS report:
The number of persons employed part time for economic reasons (some-times referred to as involuntary part-time workers) was essentially unchanged in December at 8.9 million. These individuals were working part time because their hours had been cut back or because they were unable to find a full-time job.The number of workers only able to find part time jobs (or have had their hours cut for economic reasons) declined slightly to 8.931 million in December. This has been around 9 million since early 2009 - a very high level.
These workers are included in the alternate measure of labor underutilization (U-6) that declined to 16.7% in December. Still very grim.
Unemployed over 26 Weeks
 This graph shows the number of workers unemployed for 27 weeks or more.
 According to the BLS, there are 6.441 million workers who have been unemployed for more than 26 weeks and still want a job. This was up from 6.328 million in November. It appeared the number of long term unemployed had peaked, however the increases over the last three months are very concerning.
Summary
This was a mixed report.
The best news was the decline in the unemployment rate to 9.4% from 9.8% in November. However this was partially because the participation rate declined to 64.3% - a new cycle low, and the lowest level since the early '80s. Note: This is the percentage of the working age population in the labor force (here is the graph in the galleries of the participation rate).
The 103,000 payroll jobs added was below expectations of 140,000 jobs, however payroll for October payroll was revised up 38,000 and November was revised up
The increase in the long term unemployed, and the high level of part time workers for economic reasons are ongoing concerns. The average workweek was steady at 34.3 hours, and average hourly earnings ticked up 3 cents.
• Earlier Employment post: December Employment Report: 104,000 Jobs, 9.4% Unemployment Rate


