by Calculated Risk on 1/02/2011 08:55:00 AM
Sunday, January 02, 2011
Summary for Week ending January 1st
Note: here is the economic Schedule for Week of January 2, 2011.
Below is a summary of the previous week, mostly in graphs.
• Case-Shiller: Home Prices Weaken Further in October
S&P/Case-Shiller released the monthly Home Price Indices for October last week (actually a 3 month average of August, September and October).
 Click on graph for larger image in graph gallery.
The first graph shows the nominal seasonally adjusted Composite 10 and Composite 20 indices (the Composite 20 was started in January 2000).
The Composite 10 index is off 30.7% from the peak, and down 0.9% in October(SA).
The Composite 20 index is off 30.5% from the peak, and down 1.0% in October (SA).
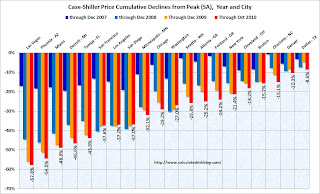
The next graph shows the price declines from the peak for each city included in S&P/Case-Shiller indices.
 Prices increased in only 2 of the 20 Case-Shiller cities in October seasonally adjusted (SA); only Denver and Wash, D.C. saw small price increases (SA). Prices fell in all cities NSA.
Prices in Las Vegas are off 57.8% from the peak, and prices in Dallas only off 8.6% from the peak.
Prices are now falling - and falling just about everywhere. As S&P noted "six markets – Atlanta, Charlotte, Miami, Portland (OR), Seattle and Tampa – hit their lowest levels since home prices started to fall in 2006 and 2007". More cities will join them soon.
 This graph shows existing home months-of-supply (left axis), and the annualized change in the Case-Shiller composite 20 house price index (right axis, inverted).
House prices are through October using the composite 20 index. Months-of-supply is through November.
We need to watch inventory and months-of-supply closely for hints about house prices. The recent surge in existing home inventory - and increase in the months-of-supply - is one of the reasons I expect house prices to fall another 5% to 10%.
• Weekly Initial Unemployment Claims below 400,000, Lowest since July 2008
From the DOL: "In the week ending Dec. 25, the advance figure for seasonally adjusted initial claims was 388,000, a decrease of 34,000 from the previous week's revised figure of 422,000."
 This graph shows the 4-week moving average of weekly claims since January 2000.
The dashed line on the graph is the current 4-week average. The four-week average of weekly unemployment claims decreased this week by 12,500 to 414,000.
In general the four-week moving average has been declining and that is good news.
• Regional Fed surveys suggest increasing manufacturing activity
Three regional surveys were released last week:
1) From the Dallas Fed: Texas Manufacturing Activity Continues to Grow
2) From Kansas City Fed: Manufacturing activity "continued at a solid pace" in December
3) From the Richmond Fed: Manufacturing Activity Expanded at a Solid Pace in December
 This graph compares the regional Fed surveys and the ISM manufacturing index.
The New York and Philly Fed surveys are averaged together (dashed green, through December), and averaged five Fed surveys (blue, through December) including New York, Philly, Richmond, Dallas and Kansas City. The Institute for Supply Management (ISM) PMI (red) is through November (right axis).
The regional surveys suggest an increase in manufacturing activity in December.
The ISM manufacturing index will released on Monday, Jan 3, 2011.
• Other Economic Stories ...
• From the NAR: Pending Home Sales Continue Recovery
• Unofficial Problem Bank list increases to 935 Institutions
Best wishes to all!


