by Calculated Risk on 1/30/2011 09:43:00 AM
Sunday, January 30, 2011
Summary for Week ending January 29th
Note: here is the economic schedule for the coming week.
• The Financial Crisis Inquiry Commission report was released. Here are the conclusions.
• Protest in Egypt: Ongoing. Link for Al Jazeera English version and Live blog 30/1 - Egypt protests
Below is a summary of the previous week, mostly in graphs.
• New Home Sales increased in December
 Click on graphs for larger image in graph gallery.
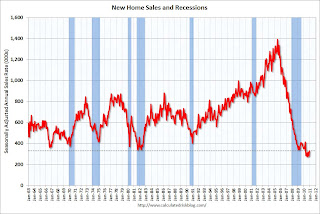
The Census Bureau reported New Home Sales in December were at a seasonally adjusted annual rate (SAAR) of 329 thousand. This is up from a revised 280 thousand in November.
The first graph shows New Home Sales vs. recessions since 1963. The dashed line is the current sales rate.
 The second graph shows existing home sales (left axis) and new home sales (right axis) through December.
This graph starts in 1994, but the relationship has been fairly steady back to the '60s. Then along came the housing bubble and bust, and the "distressing gap" appeared (due mostly to distressed sales).
• Case-Shiller: U.S. Home Prices Keep Weakening as Eight Cities Reach New Lows in November
S&P/Case-Shiller released the monthly Home Price Indices for November (actually a 3 month average of September, October and November).
 This graph shows the nominal seasonally adjusted Composite 10 and Composite 20 indices (the Composite 20 was started in January 2000).
The Composite 10 index is off 31.0% from the peak, and down 0.4% in November(SA).
The Composite 20 index is off 30.9% from the peak, and down 0.5% in November (SA).
The next graph shows the price declines from the peak for each city included in S&P/Case-Shiller indices.
 Prices increased (SA) in only 3 of the 20 Case-Shiller cities in November seasonally adjusted.
Prices in Las Vegas are off 57.8% from the peak, and prices in Dallas only off 8.9% from the peak.
Prices are now falling - and falling just about everywhere. As S&P noted "eight markets – Atlanta, Charlotte, Detroit, Las Vegas, Miami, Portland (OR), Seattle and Tampa – hit their lowest levels since home prices peaked in 2006 and 2007". Both composite indices are still slightly above the post-bubble low.
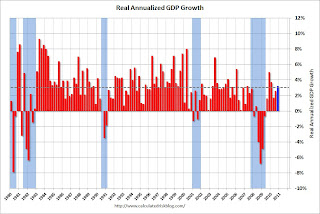
• Advance Report: Real Annualized GDP Grew at 3.2% in Q4
 This graph shows the quarterly GDP growth (at an annual rate) for the last 30 years. The dashed line is the median growth rate of 3.05%. Growth in Q4 at 3.2% annualized was slightly above trend growth - weak for a recovery, especially with all the slack in the system.
The following graph shows the rolling 4 quarter contribution to GDP from residential investment, equipment and software, and nonresidential structures. This is important to follow because residential investment tends to lead the economy, equipment and software is generally coincident, and nonresidential structure investment trails the economy.
 For this graph, red is residential, green is equipment and software, and blue is investment in non-residential structures. The usual pattern - both into and out of recessions is - red, green, blue.
The key leading sector - residential investment - has lagged this recovery because of the huge overhang of existing inventory. Usually RI is a strong contributor to GDP growth and employment in the early stages of a recovery, but not this time - and this is a key reason why the recovery has been sluggish so far.
• Moody's: Commercial Real Estate Prices increased 0.6% in November
Moody's reported that the Moody’s/REAL All Property Type Aggregate Index increased 0.6% in November.
 Here is a comparison of the Moodys/REAL Commercial Property Price Index (CPPI) and the Case-Shiller composite 20 index.
CRE prices only go back to December 2000. The Case-Shiller Composite 20 residential index is in blue (with Dec 2000 set to 1.0 to line up the indexes).
According to Moody's, CRE prices are up 2.8% from a year ago and down about 42% from the peak in 2007.
• Other Economic Stories ...
• From the Telegraph: UK economy shrinks 0.5pc
• From the BLS: Regional and State Employment and Unemployment Summary
• From the Federal Reserve: No Change in policy.
• From the NAR: Pending Home Sales Continue Uptrend
• From Bloomberg: Mortgage Rates on 30-Year U.S. Loans Increase for the Second Straight Week
• From RealtyTrac: 2010 Foreclosure Activity Down in Hardest Hit Markets But Increases in 72 Percent of Major Metros
• From the Richmond Fed: Manufacturing Activity Continues to Expand in January; Expectations Remain Upbeat
• From the Kansas City Fed: Survey of Tenth District Manufacturing
• ATA Truck Tonnage Index increased in December
• The Department of Transportation (DOT) reported that vehicle miles driven in November were up 1.1% compared to November 2009
• Unofficial Problem Bank list increases to 949 Institutions
Best wishes to all!


