by Calculated Risk on 2/13/2011 09:00:00 AM
Sunday, February 13, 2011
Summary for Week ending February 12th
Here is the busy economic schedule for the coming week.
• Egpyt
From the NY Times: Military Offers Assurances to Egypt and Neighbors
From the WSJ: Egypt's Military Moves to Clear Tahrir Square
From the Financial Times: Egyptian youth groups seek army talks
Below is a summary of the previous week, mostly in graphs.
• Trade Deficit increased in December
 Click on graphs for larger image in graph gallery.
The first graph shows the monthly U.S. exports and imports in dollars through December 2010.
December exports were $163.0 billion, up from $160.1 billion in November. December imports were $203.5 billion, up from $198.5 billion in November.
Imports had been mostly flat since May, but increased again in December. Exports have started increasing again after the mid-year slowdown.
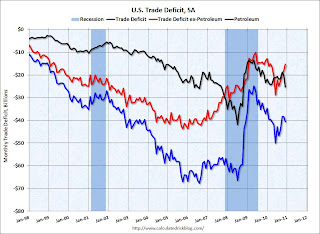
The second graph shows the U.S. trade deficit, with and without petroleum, through December.
 The blue line is the total deficit, and the black line is the petroleum deficit, and the red line is the trade deficit ex-petroleum products. The trade deficit was $40.6 billion, up from $38.3 billion in November.
The petroleum deficit increased in December as both quantity and import prices continued to rise - averaging $79.78 in December. Prices will be even higher in January. Once again oil and China deficits are essentially the entire trade deficit (or even more).
• CoreLogic: House Prices declined 1.8% in December
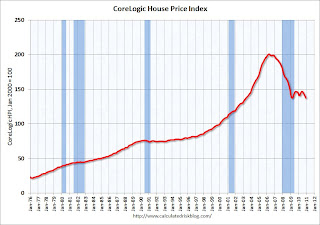
 This graph shows the national CoreLogic HPI data since 1976. January 2000 = 100.
The index is down 5.46% over the last year, and off 31.6% from the peak.
This is the fifth straight month of year-over-year declines, and the sixth straight month of month-to-month declines. The index is only 0.07% above the low set in March 2009 (essentially at the low), and I expect to see a new post-bubble low for this index with the January release.
• NFIB: Small Business Optimism Index increases in January
 From National Federation of Independent Business (NFIB): "The National Federation of Independent Business Index of Small Business Optimism rose 1.5 points in January, a modest increase, opening the new year with a reading of 94.1."
This graph shows the small business optimism index since 1986. The index increased to 94.1 in January from 92.6 in December.
Although still fairly low, this is the highest level for the index since December 2007.
 This graph shows the net hiring plans over the next three months.
Hiring plans decreased slightly in January but are still positive.
The recovery is sluggish for the small business optimism index (probably because of the high concentration of real estate related companies), but this is the highest level for the optimism index since December 2007.
• Consumer Sentiment increases slightly in February
 The preliminary Reuters / University of Michigan consumer sentiment index increased to 75.1 in February from 74.2 in January.
This was at the consensus forecast of 75.0.
Sentiment is still at levels usually associated with a recession - and sentiment is well below the pre-recession levels.
• Other Economic Stories ...
• From Treasury: Proposed plan for Fannie and Freddie press release and here is the report
• AAR: Rail Traffic increases in January
• Ceridian-UCLA: Diesel Fuel index decreases slightly in January
• Bernanke Testimony: The Economic Outlook and Monetary and Fiscal Policy
• From NY Fed Vice President Brian Sack: Implementing the Federal Reserve’s Asset Purchase Program
• CoStar: Commercial Real Estate prices increased slightly in December
• From RealtyTrac: Foreclosure Activity Increases 1 Percent in January
• Unofficial Problem Bank list at 944 Institutions
Best wishes to all!


