by Calculated Risk on 2/06/2011 08:50:00 AM
Sunday, February 06, 2011
Summary for Week ending February 5th
Note: here is the economic schedule for the coming week.
Two ongoing stories ...
• Egypt: From the NY Times: Muslim Brotherhood Join Egypt Talks
As Western powers backed the Egyptian vice president’s [Omar Suleiman] attempt to defuse a popular uprising, the outlawed Muslim Brotherhood joined other groups meeting with him on Sunday in what seemed a significant departure in the nation’s uprising and political history.• Europe: From the WSJ: European Leaders Clash at Summit
Sharp disagreements opened up among European Union leaders at a summit here over a German-led plan to boost the competitiveness of weaker euro-zone economies, threatening to unsettle recently calm European financial markets.Below is a summary of the previous week, mostly in graphs.
• January Employment Report: 36,000 Jobs, 9.0% Unemployment Rate
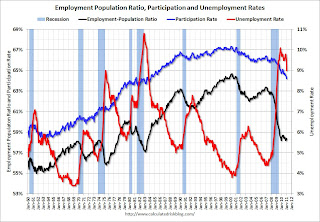
The Employment Situation report contained mixed signals with a sharp drop in the unemployment, but few payroll jobs added. The BLS mentioned that severe weather impacted the payroll report. The following graph shows the employment population ratio, the participation rate, and the unemployment rate.
 Click on graph for larger image in graph gallery.
The unemployment rate decreased to 9.0% (red line).
The Labor Force Participation Rate declined to 64.2% in January (blue line). This is the lowest level since the early '80s. (This is the percentage of the working age population in the labor force. The participation rate is well below the 66% to 67% rate that was normal over the last 20 years.)
The Employment-Population ratio increased to 58.4% in January (black line).
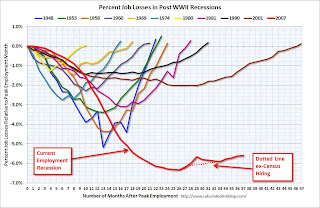
 The second graph shows the job losses from the start of the employment recession, in percentage terms from the start of the recession. The dotted line is ex-Census hiring.
 For the current employment recession, the graph starts in December 2007, and this recession is by far the worst recession since WWII in percentage terms, and 2nd worst in terms of the unemployment rate (only the early '80s recession with a peak of 10.8 percent was worse).
 The number of workers only able to find part time jobs (or have had their hours cut for economic reasons) declined to 8.407 million in January.
 These workers are included in the alternate measure of labor underutilization (U-6) that declined sharply to 16.1% in January from 16.7% in December. Still very high, but improving.
 This graph shows the number of workers unemployed for 27 weeks or more.
 According to the BLS, there are 6.21 million workers who have been unemployed for more than 26 weeks and still want a job. This was down from 6.44 million in December. This is still very high.
Summary
This was a decent report with two obvious exceptions: the few payroll jobs added, and the slight decline in the average workweek - both potentially weather related.
The best news was the decline in the unemployment rate to 9.0% from 9.4% in December. However this was partially because the participation rate declined to 64.2% - a new cycle low, and the lowest level since the early '80s.
The 36,000 payroll jobs added was far below expectations of 150,000 jobs, however this was probably impacted by bad weather during the survey reference period. If so, there should be a strong bounce back in the February report.
• Q4 2010: Homeownership Rate Falls to 1998 Levels
The Census Bureau reported the homeownership and vacancy rates for Q4 2010 this week.
 The homeownership rate was at 66.5%, down from 66.9% in Q3. This is at about the level as 1998.
The homeownership rate increased in the '90s and early '00s because of changes in demographics and "innovations" in mortgage lending. Some of the increase due to demographics (older population) will probably stick, so I've been expecting the rate to decline to around 66%, and probably not all the way back to 64%.
 The homeowner vacancy rate increased to 2.7% in Q4 2010 from 2.5% in Q3 2010.
 This has been bouncing around in the 2.5% to 2.7% range for two years, and is slightly below the peak of 2.9% in 2008.
A normal rate for recent years appears to be about 1.7%.
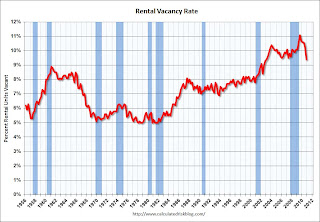
 The rental vacancy rate declined sharply to 9.4% in Q4 2010, from 10.3% in Q3 2010.
This fits with the recent Reis data showing apartment vacancy rates fell in Q4 2010 to 6.6%, down from 7.1% in Q3 2010, and 8% in the Q4 2009.
This also fits with the NMHC apartment market tightness index that has indicated tighter market conditions for the last four quarters.
• ISM Manufacturing Index increased in January
 PMI at 60.8% in January, up from 58.5% in December. The consensus was for a reading of 57.9%. ISM's New Orders Index registered 67.8 percent in January, and ISM's Employment Index registered 61.7 percent. Here is a long term graph of the ISM manufacturing index.
This was a strong report and above expectations. The new orders and employment indexes were especially strong.
• Private Construction Spending decreased in December
 This graph shows private residential and nonresidential construction spending since 1993. Note: nominal dollars, not inflation adjusted.
Both private residential and non-residential construction spending decreased in December.
Residential spending is 66.5% below the peak in early 2006, and non-residential spending is 37% below the peak in January 2008.
Sometime this year (in 2011), residential construction spending will probably pass non-residential spending. Although I expect the recovery in residential spending to be sluggish, residential investment will probably make a positive contribution to GDP and employment growth in 2011 for the first time since 2005. And that is one of the reasons I think growth (both GDP and employment) will be better in 2011 than in 2010.
• U.S. Light Vehicle Sales increased in January to 12.62 million SAAR
 Based on an estimate from Autodata Corp, light vehicle sales were at a 12.62 million SAAR in January. That is up 17.5% from January 2010, and up 1.0% from the sales rate last month (Dec 2010). This is the highest sales rate since August 2008, excluding Cash-for-clunkers in August 2009. This was at the consensus estimate of 12.6 million SAAR.
This graph shows light vehicle sales since the BEA started keeping data in 1967.
Note: dashed line is current estimated sales rate. The current sales rate is still near the bottom of the '90/'91 recession - when there were fewer registered drivers and a smaller population.
• ISM Non-Manufacturing Index showed expansion in January
 The January ISM Non-manufacturing index was at 59.4%, up from 57.1% in December. The employment index showed faster expansion in December at 54.5%, up from 52.6% in December. Note: Above 50 indicates expansion, below 50 contraction.
This graph shows the ISM non-manufacturing index (started in January 2008) and the ISM non-manufacturing employment diffusion index.
• Other Economic Stories ...
• Chicago PMI Strong
• Fed: Little Change in Lending Standards in January Loan Officer Survey, Outlook "more upbeat"
• Personal Income and Outlays Report for December
• Restaurant Performance Index Shows Expansion in December
• ADP: Private Employment increased by 187,000 in January
• Fed Chairman Bernanke: The Economic Outlook and Macroeconomic Policies
• Unofficial Problem Bank list at 946 Institutions
Best wishes to all!


