by Calculated Risk on 3/29/2011 11:24:00 AM
Tuesday, March 29, 2011
Real House Prices and Price-to-Rent
The following graph shows the quarterly Case-Shiller National Index (through Q4 2010), and the monthly Case-Shiller Composite 20 and CoreLogic House Price Indexes through January 2011 in real terms (adjusted for inflation using CPI less shelter).
Note: some people use other inflation measures to adjust for real prices.
 Click on graph for larger image in graph gallery.
In real terms, the National index is back to Q1 2000 levels, the Composite 20 index is back to January 2001, and the CoreLogic index back to May 2000.
A few key points:
• The real price indexes are all at new post-bubble lows.
• I don't expect national real prices to fall to '98 levels. In many areas - if the population is increasing - house prices increase slightly faster than inflation over time, so there is an upward slope for real prices.
• Real prices are still too high, but they are much closer to the eventual bottom than the top in 2005. This isn't like in 2005 when prices were way out of the normal range.
• Nominal prices will probably fall some more and my forecast is for a decline of 5% to 10% from the October 2010 levels for the national price indexes.
Price-to-Rent
In October 2004, Fed economist John Krainer and researcher Chishen Wei wrote a Fed letter on price to rent ratios: House Prices and Fundamental Value. Kainer and Wei presented a price-to-rent ratio using the OFHEO house price index and the Owners' Equivalent Rent (OER) from the BLS.
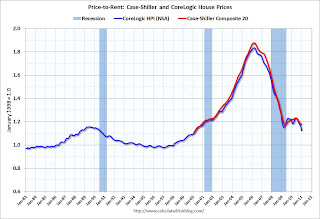
 Here is a similar graph through January 2011 using the Case-Shiller Composite 20 and CoreLogic House Price Index.
This graph shows the price to rent ratio (January 1998 = 1.0).
An interesting point: the measure of Owners' Equivalent Rent (OER) is at about the same level as two years - so the price-to-rent ratio has mostly followed changes in nominal house prices since then. Rents are starting to increase again, and OER will probably increase in 2011 - lowering the price-to-rent ratio.
This ratio could decline another 10%, and possibly more if prices overshoot to the downside. The decline in the ratio will probably be a combination of falling house prices and increasing rents.
I know some people are forecasting nominal price declines of 20% to 30% from the current level. Those forecasts are based on more distressed supply hitting the market (almost 7 million loans are delinquent and 11.1 million borrowers have negative equity). However I think that forecast for house prices is too pessimistic.
One of the reasons that prices will probably not fall that far is all the cash buyers - especially at the low end. See from Bloomberg: Cash-Paying Vultures Pick Bones of U.S. Housing Market as Mortgages Dry Up (ht Mike In Long Island, db).
Earlier:
• Case Shiller: Home Prices Off to a Dismal Start in 2011


