by Calculated Risk on 3/05/2011 11:52:00 AM
Saturday, March 05, 2011
Summary for Week ending March 4th
The U.S. expansion seems to be slowly improving; however there are several downside risks, notably higher oil prices. Let’s start with employment:
The BLS reported that payroll employment increased 192,000 in February and that the unemployment rate declined to 8.9%. If we average the last two months together - the 63,000 payroll jobs added in January and the 192,000 payroll jobs in February - there were 127,500 payroll jobs added per month. That is a barely enough to keep up with the growth in the labor force. Private payrolls were a little better at an average of 145,000 per month, as state and local governments continued to lay off workers (something we expect all year).
The decline in the unemployment rate from 9.0% to 8.9% was good news, especially since the participation rate was unchanged at 64.2%. More welcome news included the decreases in the number of long term unemployed, a slight decline in the number of part time workers for economic reasons, and the decline in U-6 to 15.9% - although the levels are still very high.
Some disappointing news was that the average workweek was unchanged at 34.2 hours, and average hourly earnings only ticked up 1 cent. It is interesting to note that construction has now added payroll jobs in 2011. I think construction will add payroll jobs this year for the first time since 2005.
Overall this was a small step in the right direction, but the overall employment situation remains grim: There are 7.5 million fewer payroll jobs now than before the recession started in 2007 with 13.7 million Americans currently unemployed. Another 8.3 million are working part time for economic reasons, and about 4 million more workers have left the labor force. Of those unemployed, 6 million have been unemployed for six months or more.
We were once again reminded last week of several potential downside risks to the U.S. economy as oil prices increased, and the European financial crisis is starting to make news again. Also state and local government cutbacks negatively impacted the employment report – with more to come.
A key focus remains on the Middle East and North Africa, and especially on the tragic events in Libya. These events have pushed U.S. oil prices to around $104 per barrel and have raised questions about the possible drag of higher oil prices on the U.S. economy.
The European financial crisis has been on the back burner, but yields are still elevated and there are key Euro Zone meetings scheduled in March. I expect this to be front page news again soon.
State and local governments reduced employment by 30,000 in February, and several state budgets were in the news, especially the ongoing Wisconsin political battles.
These are all risks to 2011 economic growth.
But most of the other economic news was positive. Growth in manufacturing continues to be strong. The ISM manufacturing index matched the May 2004 level - the highest since 1983, and the employment index was the highest since December 1973. The ISM non-manufacturing index index was also strong at 59.7%, with the employment index indicating faster expansion in February at 55.6%.
Auto sales continued to increase, reaching an estimated 13.44 million in February on a seasonally adjusted annual rate basis (SAAR). That is up 28% from February 2010, and up 6.8% from the sales rate last month (Jan 2011). This is the highest sales rate since August 2008, excluding Cash-for-clunkers in August 2009.
There was some weakness, construction spending declined in January (no surprise), and personal consumption expenditures in January were weak, but overall the expansion seems to be improving.
Below is a summary of economic data last week mostly in graphs:
• February Employment Report: 192,000 Jobs, 8.9% Unemployment Rate
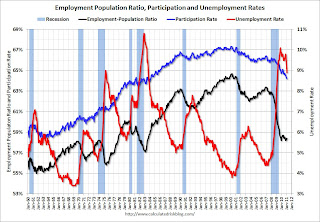
The first graph shows the employment population ratio, the participation rate, and the unemployment rate.
 Click on graphs for larger image in graph gallery.
The unemployment rate decreased to 8.9% (red line).
The Labor Force Participation Rate was unchanged at 64.2% in February (blue line). This is the lowest level since the early '80s. (This is the percentage of the working age population in the labor force. The participation rate is well below the 66% to 67% rate that was normal over the last 20 years, although some of the decline is due to the aging population.)
The Employment-Population ratio was unchanged at 58.4% in February (black line).
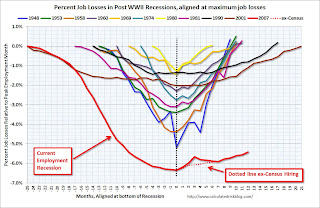
 The second graph shows the job losses from the start of the employment recession, in percentage terms aligned at maximum job losses. The dotted line is ex-Census hiring.
The current employment recession is by far the worst recession since WWII in percentage terms, and 2nd worst in terms of the unemployment rate (only the early '80s recession with a peak of 10.8 percent was worse).
 The third graph shows the job losses from the start of the employment recession, in percentage terms - this time aligned at the start of the recession.
Here are the employment posts yesterday with graphs:
Employment Summary and Part Time Workers, Unemployed over 26 Weeks
Duration of Unemployment, Unemployment by Education, Diffusion Indexes
And some analysis on the participaton rate: Participation Rate Update
To see all the graphs: Employment Graph Gallery
• Personal Income and Outlays Report for January
 This graph shows real Personal Consumption Expenditures (PCE) through January (2005 dollars). Note that the y-axis doesn't start at zero to better show the change.
Real PCE declined in January after increasing sharply in Q4. Note: The quarterly change in PCE is based on the change from the average in one quarter, compared to the average of the preceding quarter - so this still shows growth over Q4.
• ISM Manufacturing Index increases in February
 From the Institute for Supply Management: January 2011 Manufacturing ISM Report On Business®. PMI at 61.% in February, up from 60.8% in January, matching the level in May 2004 - the highest since 1983.
Here is a long term graph of the ISM manufacturing index.
This was a strong report and above expectations. The new orders and employment indexes were especially strong, with employment at 64.5, the highest since January 1973.
• ISM Non-Manufacturing Index indicates expansion in February
 The February ISM Non-manufacturing index was at 59.7%, up from 59.4% in January. The employment index indicated faster expansion in February at 55.6%, up from 54.5% in January. Note: Above 50 indicates expansion, below 50 contraction.
This graph shows the ISM non-manufacturing index (started in January 2008) and the ISM non-manufacturing employment diffusion index.
This was a solid report, except for prices, and slightly above expectations of 59.5%.
• U.S. Light Vehicle Sales 13.44 million SAAR in February
 Based on an estimate from Autodata Corp, light vehicle sales were at a 13.44 million SAAR in February. That is up 28% from February 2010, and up 6.8% from the sales rate last month (Jan 2011).
This graph shows light vehicle sales since the BEA started keeping data in 1967.
This is the highest sales rate since August 2008, excluding Cash-for-clunkers in August 2009.
Note: dashed line is current estimated sales rate. The current sales rate is finally off the bottom of the '90/'91 recession - and there were fewer registered drivers and a smaller population back then.
This was well above the consensus estimate of 12.7 million SAAR. But, with rising oil prices, the automakers might be under pressure in March.
• Private Construction Spending decreased in January
 This graph shows private residential and nonresidential construction spending since 1993. Note: nominal dollars, not inflation adjusted.
From the Census Bureau: "Residential construction was at a seasonally adjusted annual rate of $245.6 billion in January ... Nonresidential construction was at a seasonally adjusted annual rate of $244.4 billion in January ..."
Residential spending is 64% below the peak in early 2006, and non-residential spending is 41% below the peak in January 2008.
This is the first time since December 2007 that private residential construction spending has been higher than non-residential spending. Not by much, but that is something I've been expecting.
• Other Economic Stories ...
• Prepared testimony from Fed Chairman Ben Bernanke: Semiannual Monetary Policy Report to the Congress
• ADP: Private Employment increased by 217,000 in February
• DOT: Vehicle Miles Driven increased in December
• Fed's Beige Book: Economic activity continued to expand at a modest to moderate pace.
• From Fed Chairman Ben Bernanke: Challenges for State and Local Governments
• Unofficial Problem Bank list increases to 962 Institutions
Best wishes to all!


