by Calculated Risk on 3/10/2011 09:12:00 AM
Thursday, March 10, 2011
Trade Deficit increased in January to $46.3 billion
The Department of Commerce reports:
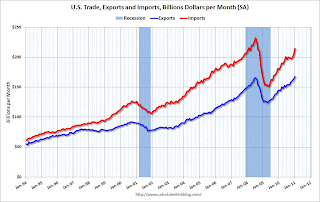
[T]otal exports of $167.7 billion and imports of $214.1 billion resulted in a goods and services deficit of $46.3 billion, up from $40.3 billion in December, revised. January exports were $4.4 billion more than December exports of $163.3 billion. January imports were $10.5 billion more than December imports of $203.6 billion.
 Click on graph for larger image.
The first graph shows the monthly U.S. exports and imports in dollars through January 2011.
Exports are up sharply and are now above the pre-recession peak. Imports have surged over the last two months, largely due to the increase in oil prices.
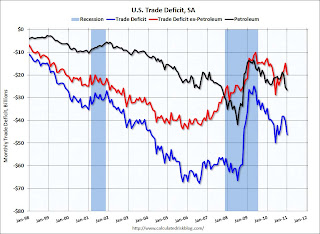
The second graph shows the U.S. trade deficit, with and without petroleum, through January.
 The blue line is the total deficit, and the black line is the petroleum deficit, and the red line is the trade deficit ex-petroleum products.
The petroleum deficit increased in January as both quantity and import prices continued to rise - averaging $84.34 in January, up from $79.78 in December. Prices will be even higher in February and March. The trade deficit with China was $23.3 billion (NSA) in January. Once again the oil and China deficits are essentially the entire trade deficit (or even more).


