by Calculated Risk on 4/29/2011 08:30:00 AM
Friday, April 29, 2011
Personal Income and Outlays Report for March
The BEA released the Personal Income and Outlays report for March:
Personal income increased $67.0 billion, or 0.5 percent ... Personal consumption expenditures (PCE) increased $60.7 billion, or 0.6 percent.Real PCE was revised up significantly for both January and February.
...
Real PCE -- PCE adjusted to remove price changes -- increased 0.2 percent in March, compared with an increase of 0.5 percent in February.
The following graph shows real Personal Consumption Expenditures (PCE) through March (2005 dollars). Note that the y-axis doesn't start at zero to better show the change.
 Click on graph for larger image in graph gallery.
PCE increased 0.5% in March, but real PCE only increased 0.2% as the price index for PCE increased 0.4 percent in March.
Note: Core PCE - PCE excluding food and energy - increased 0.1% in March.
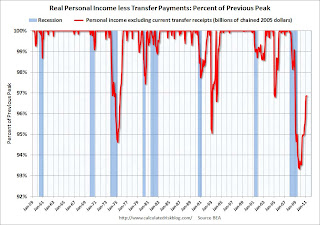
 The second graph shows real personal income less transfer payments as a percent of the previous peak. This has been slow to recover - and real personal income less transfer payments declined slightly in March. This remains 3.1% below the previous peak.
The personal saving rate was unchanged at 5.5% in March.
Personal saving -- DPI less personal outlays -- was $651.2 billion in March, compared with $647.5 billion in February. Personal saving as a percentage of disposable personal income was 5.5 percent in March, the same as in February.
 This graph shows the saving rate starting in 1959 (using a three month trailing average for smoothing) through the March Personal Income report.
 One of the surprises in the Q1 GDP report was the 2.7% annualized growth rate for PCE. PCE growth in January and February was revised up significantly, and PCE in March increased at a 3.1% annualized rate (over the last 3 months).


