by Calculated Risk on 4/09/2011 11:15:00 AM
Saturday, April 09, 2011
Summary for Week ending April 8th
This was a light week for U.S. economic data mixed in with a little political theater in D.C. The ISM non-manufacturing index showed further expansion, but at a slower rate. Rail traffic increased in March, and house prices fell further in February (no surprise).
Reis reported their Q1 quarterly data for office, mall and apartment vacancy rates. The office vacancy rate declined slightly, the mall vacancy rate increased - but the big story was the sharp decline in the apartment vacancy rate.
In Europe, Portugal finally asked for a bailout. The package is estimated at €80 billion and the austerity will probably be severe.
Next week will be busy. Below is a summary of economic data last week mostly in graphs:
• ISM Non-Manufacturing Index indicates slower expansion in March
The March ISM Non-manufacturing index was at 57.3%, down from 59.7% in February. The employment index indicated slower expansion in March at 53.7%, down from 55.6% in February. Note: Above 50 indicates expansion, below 50 contraction.
 Click on graph for larger image in graph gallery.
This graph shows the ISM non-manufacturing index (started in January 2008) and the ISM non-manufacturing employment diffusion index.
This was below expectations of 59.5%.
• CoreLogic: House Prices declined 2.7% in February, Prices now 4.1% below 2009 Lows
From CoreLogic: CoreLogic Home Price Index Shows Year-Over-Year Decline for Seventh Straight Month
 This graph shows the national CoreLogic HPI data since 1976. January 2000 = 100.
The index is down 6.7% over the last year, and off 34.5% from the peak.
This is the seventh straight month of year-over-year declines, and the eighth straight month of month-to-month declines. The index is now 4.1% below the previous post-bubble low set in March 2009, and I expect to see further new post-bubble lows for this index over the next few months.
• House Prices: Nominal, Real, Price-to-Rent
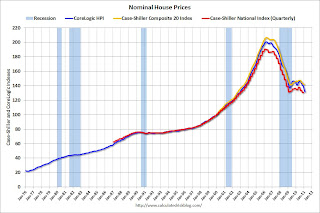
 This graph shows the quarterly Case-Shiller National Index (through Q4 2010), and the monthly Case-Shiller Composite 20 (through January release) and CoreLogic House Price Indexes (through February release) in nominal terms (as reported).
In nominal terms, the National index is back to Q1 2003 levels, the Composite 20 index is slightly above the May 2009 lows, and the CoreLogic index back to January 2003.
 This graph shows the same three indexes in real terms (adjusted for inflation using CPI less Shelter).
Note: some people use other inflation measures to adjust for real prices.
In real terms, the National index is back to Q1 2000 levels, the Composite 20 index is back to January 2001, and the CoreLogic index back to January 2000.
In October 2004, Fed economist John Krainer and researcher Chishen Wei wrote a Fed letter on price to rent ratios: House Prices and Fundamental Value. Kainer and Wei presented a price-to-rent ratio using the OFHEO house price index and the Owners' Equivalent Rent (OER) from the BLS.
 Here is a similar graph through January 2011 using the Case-Shiller Composite 20 and CoreLogic House Price Index.
This graph shows the price to rent ratio (January 1998 = 1.0).
An interesting point: the measure of Owners' Equivalent Rent (OER) is at about the same level as two years - so the price-to-rent ratio has mostly followed changes in nominal house prices since then. Rents are starting to increase again, and OER will probably increase in 2011 - lowering the price-to-rent ratio.
On a price-to-rent basis, the Composite 20 index is just above the May 2009 levels, and the CoreLogic index is back to January 2000.
• Reis: Office, Mall and Apartment Vacancy Rates in Q1
On Offices from Bloomberg: Office Market in U.S. Begins Recovery as Vacancy Rate Declines
 Reis is reporting the vacancy rate was at 17.5% in Q1 2011, down slightly from 17.6% in Q4 2010, and up from 17.3% in Q1 2010. This was a small decline in the vacancy rate - but it was the first decline since 2007.
This graph shows office investment in real dollars (left axis in blue) seasonally adjusted annual rate (SAAR), and the office vacancy rate from Reis (right axis in red).
The two arrows point at two previous periods when investment picked up as the vacancy rate declined. In the mid-'90s, it isn't clear if we should say investment picked up at the beginning of '95 or '96, but it was when the vacancy rate was around 13% or 14% and falling.
On Apartments from Reuters: U.S. apartment vacancies fall in Q1, rents edge up
 "Reis Inc's quarterly report showed the vacancy rate dropped to 6.2 percent in the first three months of the year, down from 6.6 percent in the fourth quarter. It was the steepest fall since the commercial real estate research firm began tracking the market in 1999."
This is a very large decline from the record vacancy rate set a year ago at 8%.
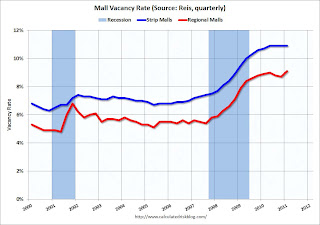
On Malls from Bloomberg: Mall Vacancies Climb to Highest in Decade as U.S. Retailers Close Stores
 "The vacancy rate [at U.S. regional malls] climbed to 9.1 percent from 8.9 percent a year earlier and 8.7 percent in the fourth quarter, [Reis reported]. It was the highest since Reis began publishing data on regional malls in the beginning of 2000.
At neighborhood and community shopping centers, which usually are anchored by discount and grocery stores, the vacancy rate rose to 10.9 percent from 10.7 percent a year earlier. The rate was unchanged from the three previous quarters and the highest since it reached 11 percent in 1991, according to Reis."
The previous record for regional malls was 9.0% in Q2 2010 (Reis started tracking regional malls in 2000). The record vacancy rate for strip malls was in 1990 at 11.1%.
• Other Economic Stories ...
• AAR: Rail Traffic increases in March
• From Reuters: Portugal's Finance Minister: We Now Need EU Aid After All
• From the Irish Times: Portugal told to implement reforms ahead of bailout
• FOMC Minutes: Some Disagreement, Worry about Oil Prices, No Tapering of QE2
• Bernanke in Q&A: "Inflation will be transitory"
• Consumer Bankruptcy filings decrease in Q1 2011
• Unofficial Problem Bank list at 982 Institutions
Best wishes to all!


