by Calculated Risk on 5/19/2011 03:48:00 PM
Thursday, May 19, 2011
Existing Home Sales: Investors, Distressed Sales and First Time Buyers
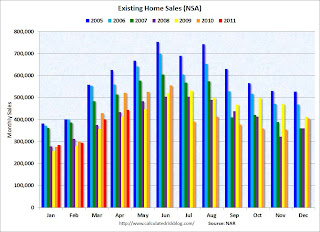
The following graph shows existing home sales Not Seasonally Adjusted (NSA).
 Click on graph for larger image in graph gallery.
The red columns are for 2011.
Sales NSA are below the tax credit boosted level of sales in April 2010, but slightly above the level of March sales in 2008 and 2009.
The level of sales is elevated due to all the investor buying. The NAR noted:
All-cash transactions stood at 31 percent in April, down from a record level of 35 percent in March; they were 26 percent in March 2010; investors account for the bulk of cash purchases.Another survey, the Campbell/Inside Mortgage Finance HousingPulse Tracking Survey "showed the proportion of first-time homebuyers in the housing market fell to 35.7% in April compared to 43.4% a year earlier.
...
First-time buyers purchased 36 percent of homes in April, up from 33 percent in March; they were 49 percent in April 2010 when the tax credit was in place. Investors slipped to 20 percent in April from 22 percent of purchase activity in March; they were 15 percent in April 2010. The balance of sales was to repeat buyers, which were 44 percent in April.
...
[The] Distressed Property Index, a key measure of the health of the U.S. housing market, fell slightly to 47.7% in April, although sales of distressed properties continued to account for nearly half of the market."
 This graph shows from Campbell/Inside Mortgage Finance HousingPulse Tracking Survey shows both distressed sales and first time buyers. From the survey:
 First-time homebuyers absorb housing supply, while move-up and move-down buyers produce no net take-up in inventory. When the supply of distressed properties exceeds the demand from first-time homebuyers, investors must step into the market to buy these properties, often at bargain-basement prices.Clearly investors are picking up the slack, and this has kept overall existing home sales elevated.
Investors accounted for 23.0% of the housing market in the month of April, up from 18.0% a year earlier, according to the HousingPulse Survey. A common business model for investors has been to buy damaged properties, renovate, and sell the properties to first-time homebuyers. But increasingly, investors are being forced to put renovated properties out as rental units as demand from first-time buyers drops.
Update for clarity: The Campbell press release suggets some investors are being "forced" to rent because they can't flip. I've spoken with several cash buyer investors who have told me they are buying for cash flow (to rent, not flip), so the word "forced" is probably inaccurate in many cases (not that it makes any difference). These buyers are helping clear out the excess inventory - although many of these properties are probably future supply.


