by Calculated Risk on 5/20/2011 03:33:00 PM
Friday, May 20, 2011
Mortgage Delinquencies by State: Before Crisis, Peak and Current (40 states)
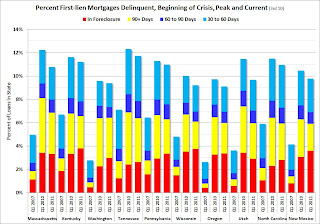
As followup to the previous post (that showed the 10 highest state by serious delinquencies), here are graphs for the 40 remaining states.
The following graphs shows the percent delinquent by bucket of delinquency for the states in Q1 2007, Q1 2010 (the peak of the crisis nationally), and Q1 2011. The order is by the current percent of loans seriously delinquent.
 Click on graph for larger image in graph gallery.
For each state there are 3 columns (Q1 2007, 2010, and 2011).
Note that the y-axis scale change between the graphs. To use this graphs, find the state of interest - and compare 2007 to 2010 and 2011 (sorry there is so much data on each graph).

NOTE: when you use the graph gallery, you can scroll between graphs - and use the "print" button (below the image on the left) to see the full size image.
 Some states always have a high rate for 30 day delinquencies (mostly southern states). These borrowers usually catch up, and this generates late fees for the lenders.
An example is Alabama on this graph. For some reason Alabama always has a high level of 30 day delinquencies - and that is why I sorted the states by serious delinquency rates (90+ days and in foreclosure).
 Nebraska has seen the smallest increase in the serious delinquency rate - just over 60% from 2.0% in Q1 2007 to 3.3% now.
At the other extreme, the serious delinquency rate in Florida increased from 1.8% in Q1 2007 to 18.97% in Q1 2011. Ouch.


