by Calculated Risk on 5/21/2011 08:15:00 AM
Saturday, May 21, 2011
Summary for Week Ending May 20th
The economic data was soft last week. The Empire State and Philly Fed manufacturing surveys showed much slower growth in May. And industrial production from the Fed (for April) showed no change, although this was probably related to supply chain issues and the earthquake in Japan.
For housing, the data was weak as usual. The NAHB survey showed builders are still depressed and the Census Bureau reported housing starts declined in April. Existing home sales also declined in April, although inventory declined year-over-year (for anyone looking for a small silver lining). But there is still 9.2 months of supply on the market - and that doesn't include the shadow inventory.
The MBA reported the percentage of delinquent first lien loans, including loans in the foreclosure process, was unchanged at the end of Q1 on a seasonally adjusted basis. This was disappointing because other indicators suggested a decline in overall delinquencies.
There was a little good news for the U.S. economy - gasoline prices are now down about 10 cents per gallon nationally from the recent peak, and initial weekly unemployment claims declined last week.
Below is a summary of economic data last week mostly in graphs:
• April Existing Home Sales: 5.05 million SAAR, 9.2 months of supply
The NAR reported: April Existing-Home Sales Ease
 Click on graph for larger image in graph gallery.
This graph shows existing home sales, on a Seasonally Adjusted Annual Rate (SAAR) basis since 1993.
Sales in April 2011 (5.05 million SAAR) were 0.8% lower than last month, and were 12.9% lower than in April 2010. According to the NAR, inventory increased to 3.87 million in April from 3.52 million in March.
Inventory is not seasonally adjusted and there is a clear seasonal pattern with inventory peaking in the summer and declining in the fall and winter. The next graph shows the year-over-year (YoY) change in reported existing home inventory and months-of-supply. Note: Months-of-supply is based on the seasonally adjusted sales and not seasonally adjusted inventory - so the increase in months-of-supply during the Spring is expected.
 Although inventory increased from March to April (as usual), inventory decreased 3.9% year-over-year in April from April 2010. This is the third consecutive month with a YoY decrease in inventory.
Inventory should increase over the next few months and peak in the summer (the normal seasonal pattern), and the YoY change is something to watch closely this year.
• Housing Starts declined in April
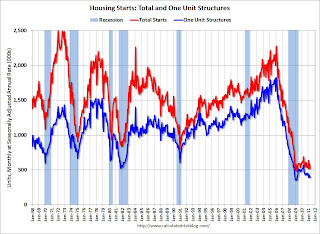
 Total housing starts were at 523 thousand (SAAR) in April, down 10.6% from the revised March rate of 585 thousand. Single-family starts decreased 5.1% to 394 thousand in April.
This graph shows total and single unit starts since 1968. This shows the huge collapse following the housing bubble, and that housing starts have mostly been moving sideways for over two years - with slight ups and downs due to the home buyer tax credit. This was well below expectations of 570 thousand starts in April.
• MBA: Total Delinquencies essentially unchanged in Q1 Seasonally Adjusted
The MBA reported that 12.84 percent of mortgage loans were either one payment delinquent or in the foreclosure process in Q1 2011 (seasonally adjusted). This is essentially the same as in Q4. There was a significant decline in Not Seasonally Adjusted (NSA) delinquencies, but that is the usual seasonal pattern.
The following graph shows the percent of loans delinquent by days past due.
 Loans 30 days delinquent increased to 3.35% from 3.26% in Q4. This is below the average levels of the last 2 years, but still higher than normal.
Delinquent loans in the 60 day bucket were unchanged at 1.35%; this is the lowest since Q2 2008. There was a slight increase in the 90+ day delinquent bucket. This increased from 3.62% in Q4 to 3.65% in Q1 2011.
The percent of loans in the foreclosure process decreased to 4.52%.
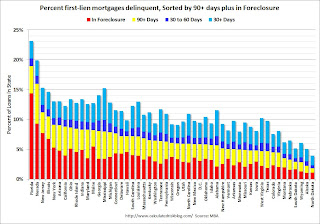
The following graph is for each state and includes all delinquent loans (sorted by percent seriously delinquent).
 Florida and Nevada have the highest percentage of serious delinquent loans, followed by New Jersey, Illinois, New York, Arizona and California.
And the next graph shows the change in the percent delinquent based on Q1 2007, Q1 2010 (the peak of the crisis nationally), and Q1 2011. These are the 10 worst states sorted by the current percent seriously delinquent.
 For each state there are 3 columns (Q1 2007, 2010, and 2011). In Ohio and Indiana, delinquency rates were already elevated by Q1 2007.
Some states have made progress: Arizona, Nevada and California. For other states like New Jersey and New York, serious delinquencies were higher in Q1 2011 than in Q1 2010.
But even though there has been some progress, there is a long way to go to get back to the 2007 rates.
Here is a post for the remaining 40 states.
• Industrial Production unchanged in April, Capacity Utilization declines slightly
From the Fed: Industrial production and Capacity Utilization
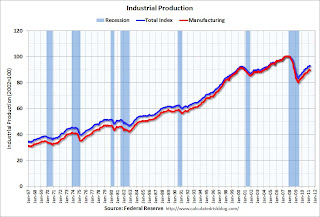
 The next graph shows industrial production since 1967.
Industrial production was unchanged in April at 93.1; previous months were revised down, so this is a decline from the previously reported level in March.
Production is still 7.6% below the pre-recession levels at the end of 2007.
The consensus was for a 0.4% increase in Industrial Production in April, and an increase to 77.6% for Capacity Utilization. So this was well below expectations - partly because of the earthquake in Japan.
• AIA: Architecture Billings Index indicates declining demand in April
Note: This index is a leading indicator for new Commercial Real Estate (CRE) investment.
From Reuters: US architecture billings index falls in April-AIA
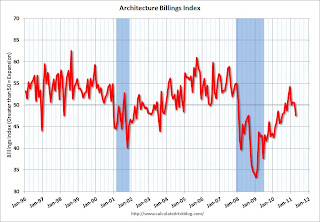
 This graph shows the Architecture Billings Index since 1996. The index showed billings decreased in April (index at 47.6, anything below 50 indicates a decrease in billings).
Note: Nonresidential construction includes commercial and industrial facilities like hotels and office buildings, as well as schools, hospitals and other institutions.
According to the AIA, there is an "approximate nine to twelve month lag time between architecture billings and construction spending" on non-residential construction.
• Other Economic Stories ...
• Empire State Manufacturing Survey indicates slower growth in May
• Philly Fed Survey shows "regional manufacturing activity grew slightly in May"
• Residential Remodeling Index increases in March
• NAHB Builder Confidence index unchanged at low level in May
Best wishes to all!


