by Calculated Risk on 6/03/2011 10:15:00 AM
Friday, June 03, 2011
Employment Summary, Part Time Workers, and Unemployed over 26 Weeks
Note: Apparently the graph server had a problem this morning. It appears to be working now (all the links were OK). Here is the employment graph gallery. Sorry for the inconvenience.
This was a very disappointing report.
There were few jobs created (only 54,000 total and 83,000 private sector). The unemployment rate increased from 9.0% to 9.1%, even though the participation rate was unchanged at 64.2%. Note: This is the percentage of the working age population in the labor force. I expect the participation rate to move a little higher as the job market improves, and that will keep the unemployment rate elevated all year.
The average workweek was unchanged at 34.4 hours, and average hourly earnings increased slightly. "In May, average hourly earnings for all employees on private nonfarm payrolls increased by 6 cents, or 0.3 percent, to $22.98. Over the past 12 months, average hourly earnings increased by 1.8 percent."
We have to remember that this is just one month - even if the numbers were dismal. So far the economy has added 908,000 private sector jobs this year, or about 181 thousand per month. There have been 783,000 total non-farm jobs added this year or 157 thousand per month. This is a better pace of payroll job creation than last year, but the economy still has 6.95 million fewer payroll jobs than at the beginning of the 2007 recession. At this pace (157 thousand jobs per month), it will take almost 4 years just to get back to the pre-recession level, or sometime in late 2014 or early 2015!
There are a total of 13.9 million Americans unemployed and 6.2 million have been unemployed for more than 6 months. Very grim numbers.
Overall this was a weak report and reminds us that unemployment and underemployment are critical problems in the U.S.
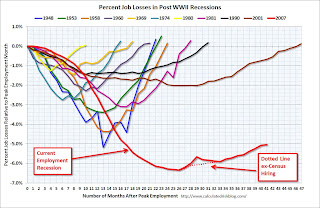
Percent Job Losses During Recessions
 Click on graph for larger image in graph gallery.
This graph shows the job losses from the start of the employment recession, in percentage terms - this time aligned at the start of the recession.
In the previous post, the graph showed the job losses aligned at maximum job losses.
In terms of lost payroll jobs, the 2007 recession is by far the worst since WWII.
Part Time for Economic Reasons
 From the BLS report:
The number of persons employed part time for economic reasons (sometimes referred to as involuntary part-time workers) was essentially unchanged in May at 8.5 million. These individuals were working part time because their hours had been cut back or because they were unable to find a full-time job.The number of workers only able to find part time jobs (or have had their hours cut for economic reasons) decreased slightly to 8.548 million in May from 8.6 million in April.
These workers are included in the alternate measure of labor underutilization (U-6) that decreased slightly to 15.8% in May from 15.9% in April. This is very high.
Unemployed over 26 Weeks
 This graph shows the number of workers unemployed for 27 weeks or more.
 According to the BLS, there are 6.2 million workers who have been unemployed for more than 26 weeks and still want a job. This was up from 5.839 million in April. This remains very high, and long term unemployment is one of the defining features of this employment recession.
• Earlier Employment post: May Employment Report: 54,000 Jobs, 9.1% Unemployment Rate


