by Calculated Risk on 7/20/2011 11:41:00 AM
Wednesday, July 20, 2011
Existing Home Sales: Comments and NSA Graph
A few comments and a graph (of course):
• The NAR reported that inventory increased in June from May (the normal seasonal pattern), and that inventory is off 3.1% from June 2010. Other data sources suggest that the NAR is overstating inventory (inventory will be part of the coming revisions). Inventory is probably down more year-over-year (YoY) than the NAR reported.
• The NAR provided an update on the timing of the "benchmark revisions". The release will be in the fall, and the revisions will be down (no surprise):
Update on Benchmark Revisions: ... NAR began its normal process for benchmarking sales at the beginning of this year in consultation with government agencies, outside housing economists and academic experts; there will be no change to median prices. Although there will be a downward revision to sales volumes, there will be no notable change to previous characterizations of the market in terms of sales trends, monthly percentage changes, etc.This revision is expected to show significantly fewer homes sold over the last few years (perhaps 10% to 15% fewer homes in 2010 than originally reported), and also fewer homes for sale.
... so we’ve had to develop a new approach with an independent source to improve methodology and to permit more frequent revisions.
Preliminary data based on the new benchmark is expected to be available for review in August. ... Publication of the revisions is not likely before this fall, but we expect to provide a notice one month in advance of the publication date.
Hopefully the NAR will provide 1) the revised data for the last decade and 2) a description of the new methodology (as part of this revision, the NAR is expected to change their method for estimating sales and inventory).
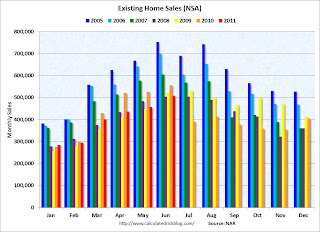
• The following graph shows existing home sales Not Seasonally Adjusted (NSA).
 Click on graph for larger image in graph gallery.
The red columns are for 2011.
Sales NSA are below the tax credit boosted level of sales in June 2010 and June 2009, but slightly above the level of June sales in 2008.
Last year sales collapsed in July (orange column - after the expiration of the tax credit), so expect a report of a large YoY increase in sales announced next month.
The level of sales is still elevated due to investor buying. The NAR noted:
All-cash transactions accounted for 29 percent of sales in June; they were 30 percent in May and 24 percent in June 2010; investors account for the bulk of cash purchases.• As Tom Lawler noted yesterday, the Pending Home Sales Index will probably show an increase in June - and reported sales in July will probably be higher than in June. The Pending Home Sales Index will be released on Thursday July 28th.
First-time buyers purchased 31 percent of homes in June, down from 36 percent in May; they were 43 percent in June 2010 when the tax credit was in place. Investors accounted for 19 percent of purchase activity in June, unchanged from May; they were 13 percent in June 2010.
Earlier:
• Existing Home Sales in June: 4.77 million SAAR, 9.5 months of supply
• Existing Home Sales graphs


