by Calculated Risk on 7/30/2011 04:58:00 PM
Saturday, July 30, 2011
Schedule for Week of July 31st
Earlier:
• Summary for Week ending July 29th
The key report for this week will be the July employment report to be released on Friday, August 5th. The ISM manufacturing report will be released on Monday, and the ISM non-manufacturing report on Wednesday. Also the automakers report July vehicle sales on Tuesday.
Note: It is unclear if the employment report will be delayed if Congress fails to raise the debt ceiling (government employees could continue working without pay).
10:00 AM ET: ISM Manufacturing Index for July. The consensus is for a decrease to 54.3 from 55.3 in June.
10:00 AM: Construction Spending for June. The consensus is for no change in construction spending.
8:30 AM: Personal Income and Outlays for June. The consensus is for a 0.2% increase in personal income in June, and a 0.1% increase in personal spending, and for the Core PCE price index to increase 0.2%. The revisions will show significantly lower consumption earlier this year.
All day: Light vehicle sales for July. Light vehicle sales are expected to increase to 11.9 million (Seasonally Adjusted Annual Rate), from 11.4 million in June.
 This graph shows light vehicle sales since the BEA started keeping data in 1967. The dashed line is the June sales rate.
 Edmunds is forecasting: "Toyota appears to be well on its way toward recovery following its new car sales and inventory struggles over the past few months, according to Edmunds.com’s July 2011 U.S. automotive sales forecast.
...
Edmunds.com estimates ... a Seasonally Adjusted Annualized Rate (SAAR) of 12.3 million light vehicles, nearly one million more than the 11.4 million SAAR reported in June."
7:00 AM: The Mortgage Bankers Association (MBA) will release the mortgage purchase applications index. This index has been very weak over the last couple months suggesting weak home sales through summer (not counting all cash purchases).
8:15 AM: The ADP Employment Report for July. This report is for private payrolls only (no government). The consensus is for +100,000 payroll jobs in July, down from the +157,000 reported in June.
 10:00 AM: ISM non-Manufacturing Index for July. The consensus is for a slight increase to 54.0 in July.
 This graph shows the ISM non-manufacturing index (started in January 2008) and the ISM non-manufacturing employment diffusion index. The June ISM Non-manufacturing index was at 53.3%, down from 54.6% in May. The employment index increased in June to 54.1%, up from 54.0% in May. Note: Above 50 indicates expansion, below 50 contraction.
10:00 AM: Manufacturers' Shipments, Inventories and Orders for June (Factory Orders). The consensus is for a 1.0% decrease in orders.
8:30 AM: The initial weekly unemployment claims report will be released. The consensus is for an increase to 403,000 from 398,000 last week.
8:30 AM: Employment Report for July.
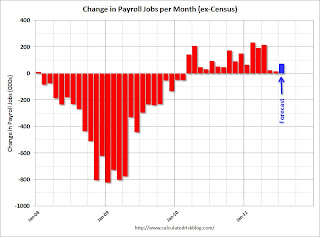
 The consensus is for an increase of 75,000 non-farm payroll jobs in July, up from the 18,000 jobs added in June. I'll take the under.
This graph shows the net payroll jobs per month (excluding temporary Census jobs) since the beginning of the recession. The consensus forecast for July is in blue.
The consensus is for the unemployment rate to hold steady at 9.2% in July.
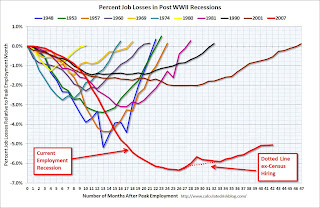
 This second employment graph shows the percentage of payroll jobs lost during post WWII recessions. This shows the severe job losses during the recent recession.
 Through the first six months of 2011, the economy has added 757,000 total non-farm jobs or just 126 thousand per month. There have been 945,000 private sector jobs added, or about 158 thousand per month. This is a better pace of payroll job creation than last year, but the economy still has 6.98 million fewer payroll jobs than at the beginning of the 2007 recession.
3:00 PM: Consumer Credit for June. The consensus is for a $5.1 billion increase in consumer credit.


